

A 5' Promoter Region SNP in CTSC Leads to Increased Hypoxia Tolerance in Changfeng Silver Carp (Hypophthalmichthys molitrix)
- PMID: 40003014
- PMCID: PMC11851654
- DOI: 10.3390/ani15040532
A 5' Promoter Region SNP in CTSC Leads to Increased Hypoxia Tolerance in Changfeng Silver Carp (Hypophthalmichthys molitrix)
Abstract
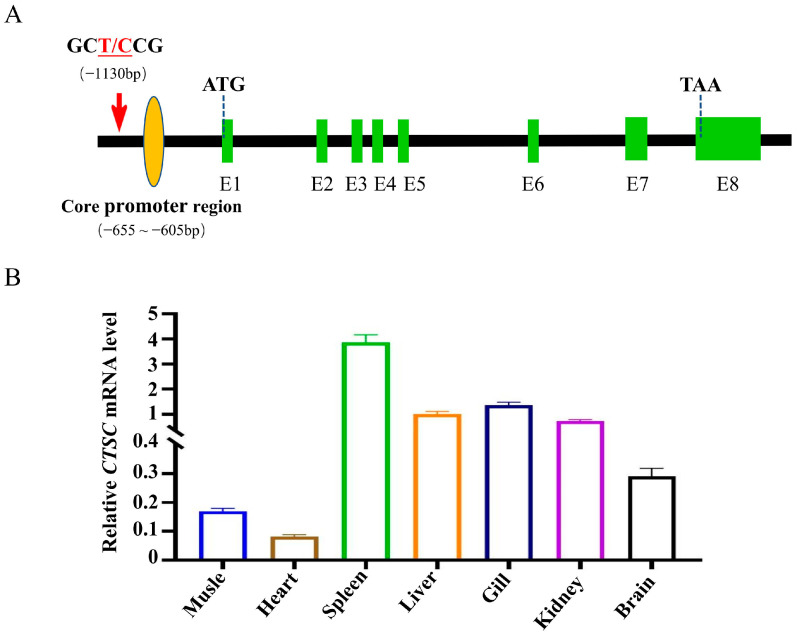
Silver carp is a critically significant species in freshwater aquaculture in China, characterized by its limited tolerance to hypoxia. In this study, a significant SNP locus at Chr8: 29647765 (T/C) associated with hypoxia tolerance traits was identified in Changfeng silver carp, and the homozygotic CC genotype exhibited higher hypoxic tolerance than the homozygotic TT and heterozygotic TC genotypes. Under hypoxic conditions, the hemoglobin concentration increased, with the CC genotype demonstrating a significantly higher level compared with the TT genotype; the activities of antioxidant enzymes including catalase and superoxide dismutase were significantly higher in the CC genotype than in the other genotypes; the area of the gill lamellae was significantly smaller in the CC genotype than in the TT and TC genotypes; and the number of apoptotic cells in the brain was significantly lower in the CC genotype than in the TT and TC genotypes. Sequence analysis showed that this SNP was located in the promoter region of the cathepsin C (CTSC) gene. The expression levels of the CTSC gene were analyzed across the three genotypes, revealing that the CC genotype exhibited significantly lower expression compared with the TT and TC genotypes under hypoxia. This finding suggests that the SNP associated with the CC genotype leads to reduced CTSC expression, which may facilitate better physiological adaptation to hypoxia. Analysis of the promoter region of CTSC found a unique predicted hypoxia-inducible factor 1-alpha (HIF-1α) binding site (CGTG) in the T genotype, implying that the differential expression of CTSC among the three genotypes under hypoxic stress may be regulated by HIF-1α, a transcription factor integral to hypoxia adaptation, thereby affecting hypoxia tolerance, which further affects the immune response of the Changfeng silver carp in response to the hypoxic environment. Although SNPs represent significant genetic determinants, their phenotypic effects are predominantly mediated through complex interactions within gene regulatory networks and environmental influences. This study identified an effective SNP site in Changfeng silver carp, providing valuable guidance for future selective breeding and the development of new hypoxia-tolerant varieties.
Keywords: CTSC; HIF-1α; Hypophthalmichthys molitrix; SNP; hypoxia.
Conflict of interest statement
The authors declare no conflicts of interest. The funders had no role in the design of the study; in the collection, analyses, or interpretation of data; in the writing of the manuscript or in the decision to publish the results.
Figures


Similar articles
-
Prior heatwave exposure improves hypoxia tolerance in a typical freshwater fish species.Comp Biochem Physiol A Mol Integr Physiol. 2025 Apr;302:111803. doi: 10.1016/j.cbpa.2025.111803. Epub 2025 Jan 3. Comp Biochem Physiol A Mol Integr Physiol. 2025. PMID: 39756789
-
Physiological responses and molecular strategies in heart of silver carp (Hypophthalmichthys molitrix) under hypoxia and reoxygenation.Comp Biochem Physiol Part D Genomics Proteomics. 2021 Dec;40:100908. doi: 10.1016/j.cbd.2021.100908. Epub 2021 Aug 27. Comp Biochem Physiol Part D Genomics Proteomics. 2021. PMID: 34482099
-
The Effect of Salinity Stress on Enzyme Activities, Histology, and Transcriptome of Silver Carp (Hypophthalmichthys molitrix).Biology (Basel). 2022 Oct 27;11(11):1580. doi: 10.3390/biology11111580. Biology (Basel). 2022. PMID: 36358281 Free PMC article.
-
Hypoxia inducible factor-1 alpha and prolinhydroxlase 2 polymorphisms in patients with severe sepsis: a prospective observational trial.BMC Anesthesiol. 2016 Aug 11;16(1):61. doi: 10.1186/s12871-016-0225-y. BMC Anesthesiol. 2016. PMID: 27515179 Free PMC article.
-
Silver Carp (Hypophthalmichthys molitrix) (Asian Silver Carp) Presence in Danube Delta and Romania-A Review with Data on Natural Reproduction.Life (Basel). 2022 Oct 12;12(10):1582. doi: 10.3390/life12101582. Life (Basel). 2022. PMID: 36295017 Free PMC article. Review.
Cited by
-
Comprehensive Evaluation of Growth Performance, Hematological Parameters, Antioxidant Capacity, Innate Immunity, and Disease Resistance in Crucian Carp (Carassius auratus) Lacking Intermuscular Bones.Antioxidants (Basel). 2025 Apr 8;14(4):443. doi: 10.3390/antiox14040443. Antioxidants (Basel). 2025. PMID: 40298788 Free PMC article.
References
-
- Le D.V., Alfaro A.C., Ragg N.L.C., Hilton Z., King N. Aerobic scope and oxygen regulation of New Zealand geoduck (Panopea zelandica) in response to progressive hypoxia. Aquaculture. 2016;463:28–36. doi: 10.1016/j.aquaculture.2016.05.008. - DOI
-
- Xu J., Liu Y., Cui S., Miao X. Behavioral responses of tilapia (Oreochromis niloticus) to acute fluctuations in dissolved oxygen levels as monitored by computer vision. Aquac. Eng. 2006;35:207–217. doi: 10.1016/j.aquaeng.2006.02.004. - DOI
-
- Abdel-Tawwab M., Hagras A.E., Elbaghdady H.A.M., Monier M.N. Effects of dissolved oxygen and fish size on Nile tilapia, Oreochromis niloticus (L.): Growth performance, whole-body composition, and innate immunity. Aquac. Int. 2015;23:1261–1274. doi: 10.1007/s10499-015-9882-y. - DOI
Grants and funding
LinkOut - more resources
Full Text Sources
Research Materials
