

Exploring Climate and Air Pollution Mitigating Benefits of Urban Parks in Sao Paulo Through a Pollution Sensor Network
- PMID: 40003531
- PMCID: PMC11854963
- DOI: 10.3390/ijerph22020306
Exploring Climate and Air Pollution Mitigating Benefits of Urban Parks in Sao Paulo Through a Pollution Sensor Network
Abstract
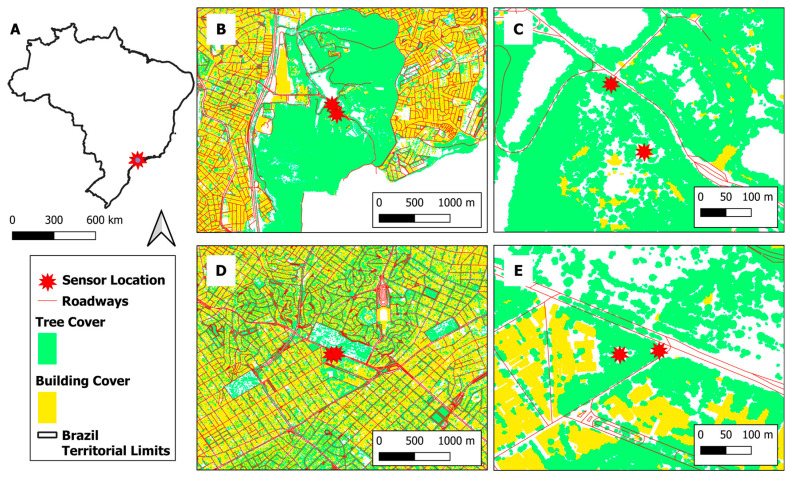
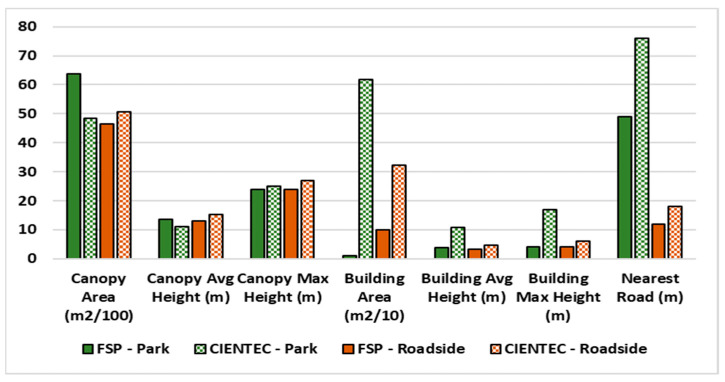
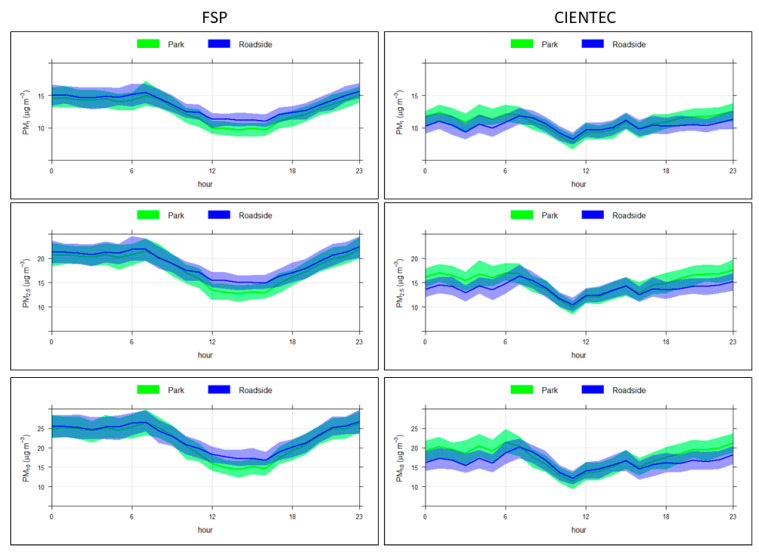
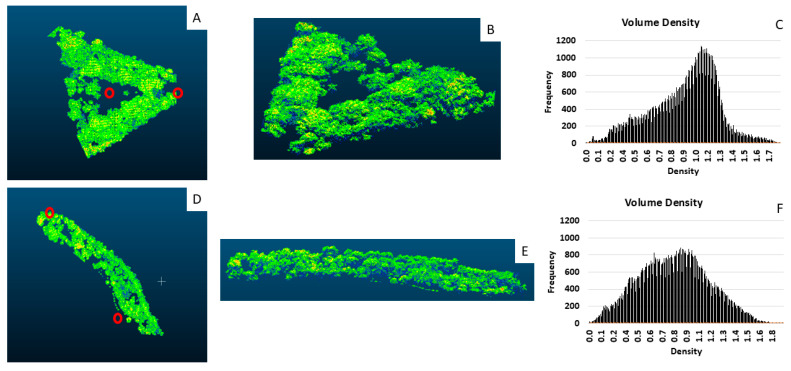
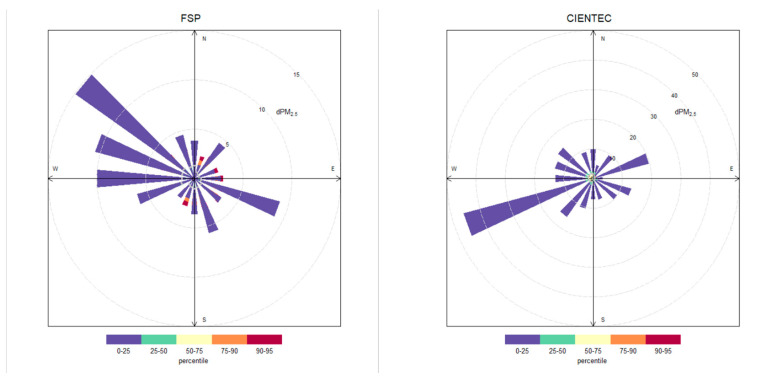
Ambient air pollution is the most important environmental factor impacting human health. Urban landscapes present unique air quality challenges, which are compounded by climate change adaptation challenges, as air pollutants can also be affected by the urban heat island effect, amplifying the deleterious effects on health. Nature-based solutions have shown potential for alleviating environmental stressors, including air pollution and heat wave abatement. However, such solutions must be designed in order to maximize mitigation and not inadvertently increase pollutant exposure. This study aims to demonstrate potential applications of nature-based solutions in urban environments for climate stressors and air pollution mitigation by analyzing two distinct scenarios with and without green infrastructure. Utilizing low-cost sensors, we examine the relationship between green infrastructure and a series of environmental parameters. While previous studies have investigated green infrastructure and air quality mitigation, our study employs low-cost sensors in tropical urban environments. Through this novel approach, we are able to obtain highly localized data that demonstrates this mitigating relationship. In this study, as a part of the NERC-FAPESP-funded GreenCities project, four low-cost sensors were validated through laboratory testing and then deployed in two locations in São Paulo, Brazil: one large, heavily forested park (CIENTEC) and one small park surrounded by densely built areas (FSP). At each site, one sensor was located in a vegetated area (Park sensor) and one near the roadside (Road sensor). The locations selected allow for a comparison of built versus green and blue areas. Lidar data were used to characterize the profile of each site based on surrounding vegetation and building area. Distance and class of the closest roadways were also measured for each sensor location. These profiles are analyzed against the data obtained through the low-cost sensors, considering both meteorological (temperature, humidity and pressure) and particulate matter (PM1, PM2.5 and PM10) parameters. Particulate matter concentrations were lower for the sensors located within the forest site. At both sites, the road sensors showed higher concentrations during the daytime period. These results further reinforce the capabilities of green-blue-gray infrastructure (GBGI) tools to reduce exposure to air pollution and climate stressors, while also showing the importance of their design to ensure maximum benefits. The findings can inform decision-makers in designing more resilient cities, especially in low-and middle-income settings.
Keywords: air quality; cities; climate stressors; green–blue–gray infrastructure; low-cost sensors; particulate matter.
Conflict of interest statement
The authors declare no conflicts of interest.
Figures
References
-
- McMichael A.J., Wilkinson P., Kovats R.S., Pattenden S., Hajat S., Armstrong B., Vajanapoom N., Niciu E.M., Mahomed H., Kingkeow C., et al. International Study of Temperature, Heat and Urban Mortality: The “ISOTHURM” Project. Int. J. Epidemiol. 2008;37:1121–1131. doi: 10.1093/ije/dyn086. - DOI - PubMed
-
- United States Environmental Protection Agency . Supplement to the 2019 Integrated Science Assessment for Particulate Matter (External Review Draft) United States Environmental Protection Agency; Washington, DC, USA: 2021. - PubMed
-
- World Health Organization . WHO Global Air Quality Guidelines: Particulate Matter (PM2.5 and PM10), Ozone, Nitrogen Dioxide, Sulfur Dioxide and Carbon Monoxide. WHO; Geneva, Switzerland: 2021. - PubMed
MeSH terms
Substances
Grants and funding
LinkOut - more resources
Full Text Sources
Medical
