. 2025 Feb 8;26(4):1430.
doi: 10.3390/ijms26041430.

Mint3 as a Molecular Target Activated in the Early Stage of Hepatocarcinogenesis

Affiliations

Mint3 as a Molecular Target Activated in the Early Stage of Hepatocarcinogenesis

Masaki Nishitani et al. Int J Mol Sci. .

Abstract

Mint3 enhances aerobic ATP production with subsequent nuclear translocation of hypoxia-inducible factor-1 (HIF-1) and activation of angiogenesis-related genes. It remains unclear if and when Mint3 is activated and whether it is involved in hepatocarcinogenesis. We explored the expression of Mint3 in surgically resected hepatocellular carcinoma (HCC) tissues. We evaluated the effects of Mint3 knockdown on spheroid formation capacity and subcutaneous tumor growth in immune-deficient mice. We used Mint3 knockout mice to evaluate the effects of chemically induced HCC development. Mint3 was overexpressed in well-differentiated HCC with the activation of HIF-1 target genes irrespective of the absence of hypervascularization. Mint3 knockdown ameliorated the expression of HIF-1 target genes in patient-derived HCC cell lines and suppressed spheroid formation. Mint3 knockdown further inhibited subcutaneous tumor formation in vivo in immune-deficient mice. Chemical HCC development induced by N-nitrosodiethylamine (DEN) or DEN/CCl4 was dramatically suppressed in Mint3 knockout mice compared to control mice. Mint3 plays a crucial role in early-stage HCC development before hypervascularization by activating HIF-1 target genes before the tumor becomes hypoxic. Mint3 is a molecular target that prevents HCC development in the early stages.

Keywords: hepatocellular carcinoma; hypoxia-inducible factor-1; munc18-1-interacting protein 3.


Conflict of interest statement

The authors declare no conflicts of interest.

Figures

Figure 1
Figure 1
Expression of Mint3 and HIF-1 target proteins in hepatocellular carcinoma presenting a nodular appearance. (A,B) Gd-EOB-DTPA-enhanced magnetic resonance images: (A) arterial phase; (B) hepatobiliary phase. Red arrows (A) indicate hypervascular region in the nodule. Red asterisk (A,B) indicates hypovascular region with mild uptake of Gd-EOB-DTPA detected at hepatobiliary phase. (C) Microscopic image stained with hematoxylin and eosin. (DF) Immunohistochemistry analysis of Mint3 (D), VEGFA (E), and HK2 (F) expression in HCC. Yellow dotted line indicates the boundary line between well-differentiated HCC and moderately differentiated HCC. Red asterisk (CF) indicates well-differentiated HCC region. The ratio of staining intensity of well to that of moderately was slightly higher in well-differentiated HCC. Black scale bars in microscopic images indicate 100 μm.
Figure 2
Figure 2
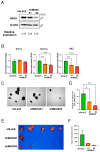
Suppression of Mint3 expression attenuates expression of HIF-1 target genes and tumorigenicity in well-differentiated HCC patient-derived KH cells. (A) Western blot analysis of Mint3 expression in control (shLacZ) and Mint3-suppressed (shMint3#1 and #2) KH cells. The results of quantification of blots were defined as the relative expression. (B) qRT-PCR analysis of HIF1A, VEGFA, and HK2 in control and Mint3-suppressed KH cells. ** p < 0.01, *** p < 0.001, **** p < 0.0001. (C) Representative photographs of spheroids in control and Mint3-suppressed KH cells. (D) Number of spheroids per 2000 control and Mint3-suppressed KH cells. * p < 0.05, ** p < 0.01. (E,F) The tumorigenic capacity of control and Mint3-suppressed KH cells in subcutaneous xenograft models using NOD/SCID mice. (E) Photos of tumors at the endpoint. (F) Median tumor volumes of control (n = 5) and Mint3-suppressed KH cells (shMint3#1; n = 5, shMint3#2; n = 5). Statistical analysis could not be performed because only one (shMint3#1) and two (shMint3#2) subcutaneous tumors developed in NOD/SCID mice.
Figure 3
Figure 3
Impairment of DEN-induced hepatocarcinogenesis in Mint3 knockout (KO) mice. (A) Administration method and schedule of carcinogen (DEN 95 μg/mouse; intraperitoneal, indicated as green arrow). (B) The incidence ratio of HCC in wild-type (WT) and Mint3 KO mice. * p < 0.05 by Fisher’s exact test. (C) A representative photomicrograph of the liver from WT (n = 7) and Mint3 KO mice (n = 7). (D) Median liver weight of WT (n = 7) and Mint3 KO mice (n = 15). * p < 0.05 by the Mann–Whitney U tests. (E) H&E staining images of the tumor developed in WT (left panel) and Mint3 KO (right panel) mice. Black scale bars in microscopic images indicate 100 μm.
Figure 4
Figure 4
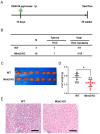
Impairment of DEN/CCl4-induced hepatocarcinogenesis in Mint3 KO mice. (A) Administration method and schedule of carcinogen (DEN 95 μg/mouse; intraperitoneal, indicated with green arrow, CCl4 20 μL/mouse; intraperitoneal, indicated with yellow arrows). (B) The incidence rate of HCC in WT and Mint3 KO mice. (C) A representative photomicrograph of the liver from WT (n = 7) and Mint3 KO mice (n = 7). (D) Median liver weight of WT (n = 12) and Mint3 KO mice (n = 16). **** p < 0.0001 by the Mann–Whitney U tests. (E) H&E staining images of the tumor developed in WT (left panel) and Mint3 KO (right panel) mice. Black scale bars in microscopic images indicate 100 μm.
Figure 5
Figure 5
Survival analysis of WT and Mint3 KO mice in DEN/CCl4-induced HCC models. (A) Administration method and schedule of carcinogen (DEN 95 μg/mouse; intraperitoneal, indicated with green arrow, CCl4 20 μL/mouse; intraperitoneal, indicated with yellow arrows). (B) A representative photomicrograph of the liver from WT (n = 3) and Mint3 KO mice (n = 3) at the endpoint. (C) Kaplan–Meier survival curves of WT (black line, n = 12) and Mint3 KO mice (red line, n = 6) in the DEN/CCl4-induced HCC model. *** p < 0.001 by the log-rank test.

References

    1. Villanueva A. Hepatocellular Carcinoma. N. Engl. J. Med. 2019;380:1450–1462. doi: 10.1056/NEJMra1713263. - DOI - PubMed
    1. Bray F., Ferlay J., Soerjomataram I., Siegel R.L., Torre L.A., Jemal A. Global cancer statistics 2018: GLOBOCAN estimates of incidence and mortality worldwide for 36 cancers in 185 countries. CA Cancer J. Clin. 2018;68:394–424. doi: 10.3322/caac.21492. - DOI - PubMed
    1. Llovet J.M., Willoughby C.E., Singal A.G., Greten T.F., Heikenwälder M., El-Serag H.B., Finn R.S., Friedman S.L. Nonalcoholic steatohepatitis-related hepatocellular carcinoma: Pathogenesis and treatment. Nat. Rev. Gastroenterol. Hepatol. 2023;20:487–503. doi: 10.1038/s41575-023-00754-7. - DOI - PubMed
    1. Singal A.G., Kanwal F., Llovet J.M. Global trends in hepatocellular carcinoma epidemiology: Implications for screening, prevention and therapy. Nat. Rev. Clin. Oncol. 2023;20:864–884. doi: 10.1038/s41571-023-00825-3. - DOI - PubMed
    1. Bertuccio P., Turati F., Carioli G., Rodriguez T., La Vecchia C., Malvezzi M., Negri E. Global trends and predictions in hepatocellular carcinoma mortality. J. Hepatol. 2017;67:302–309. doi: 10.1016/j.jhep.2017.03.011. - DOI - PubMed

Substances

LinkOut - more resources