. 2025 Feb 9;26(4):1445.
doi: 10.3390/ijms26041445.

Genome-Wide Identification and Expression Analysis of the Phosphate Transporter Gene Family in Zea mays Under Phosphorus Stress

Affiliations

Genome-Wide Identification and Expression Analysis of the Phosphate Transporter Gene Family in Zea mays Under Phosphorus Stress

Yueli Wang et al. Int J Mol Sci. .

Abstract

Phosphorus is one of the key limiting factors for maize growth and productivity, and low-phosphorus stress severely restricts crop yield and stability. Enhancing the ability of maize to grow under low-phosphorus stress and improving phosphorus use efficiency (PUE) are crucial for achieving high and stable yields. Phosphate transporter (PHT) family proteins play a crucial role in the absorption, transport, and utilization of phosphorus in plants. In this study, we systematically identified the PHT gene family in maize, followed by the phylogenetic, gene structure, and expression profiles. The results show that these genes are widely distributed across the 10 chromosomes of maize, forming multiple subfamilies, with the PHT1 subfamily having the largest number. Cis-regulatory element analysis revealed that these genes might play key roles in plant stress responses and hormone regulation. Transcriptome analysis under phosphorus-deficient and normal conditions demonstrated developmental stage- and tissue-specific expression patterns, identifying candidate genes, such as ZmPHT1-3, ZmPHT1-4, ZmPHT1-10, and ZmPHO1-H3, involved in phosphorus stress response. This study presents a comprehensive and systematic analysis of the PHT gene family in maize, providing key molecular resources for improving phosphorus use efficiency and breeding phosphorus-efficient maize varieties.

Keywords: PHT family; low-phosphorus stress; maize; stress responses.


Conflict of interest statement

The authors declare no conflicts of interest.

Figures

Figure 1
Figure 1
Chromosomal localization of ZmPHT genes in maize. The positions of ZmPHT gene members are marked on each chromosome. The blue bands on the chromosomes represent gene density, with darker colors indicating higher gene density in that region.
Figure 2
Figure 2
Phylogenetic tree of PHT family members across different species. The tree was constructed based on the PHT protein sequences from maize, rice, Arabidopsis, tomato, white lupin, and sorghum. The outer circular annotations display the physicochemical properties of PHT proteins, including the grand averages of hydropathicity (I), isoelectric point (II), aliphatic index (III), and instability index (IV). Subcellular localization predictions are represented with distinct icons indicating the chloroplast (Chl), cytoplasm (Cyt), endoplasmic reticulum (ER), extracellular space (Ext), mitochondria (Mt), nucleus (Nuc), plasma membrane (PM), and vacuole (Vac). The outermost ring groups the PHT subfamily members. Different colored lines represent different PHT subfamilies.
Figure 3
Figure 3
Structural analysis of the ZmPHT gene family in maize. The upper-right corner of each panel shows the legend corresponding to the figure, and the scale at the bottom represents the length of the protein sequence or gene sequence for each ZmPHT family member. Numbers within the colored boxes represent different conserved motifs, as indicated in the legend on the right.
Figure 4
Figure 4
Cis-regulatory element analysis of ZmPHT genes in maize. (a) The number of different types of cis-regulatory elements in the promoter sequences of ZmPHT genes is shown, including elements related to growth and development, hormone response, light regulation, signal transduction, and stress response. The bar chart shows the number of cis-elements, with similar color schemes representing the same functional categories, such as shades of red representing growth and development, blue shades representing hormone response, green shades representing light and environmental sensing, beige shades representing the regulation of signaling elements, and orange shades representing stress response. (b) Cis-regulatory element distribution in the ZmPHT genes. The scale at the bottom represents the 2000 bp upstream sequence for each ZmPHT gene.
Figure 5
Figure 5
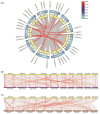
Synteny analysis of PHT gene families in different plants. (a) Synteny Circos plot within the maize genome. The inner ring indicates chromosome numbers, and the bar charts outside the chromosomes display gene density, with darker colors representing higher gene density. The numbers in the yellow ring represent maize chromosome numbers, while the red connecting lines indicate syntenic gene pairs. (b) Synteny plot between maize lines B73 and Mo17. Yellow lines represent the chromosomes of the B73 line, purple lines represent the chromosomes of the Mo17 line, and the red connecting lines show syntenic gene pairs between the two maize inbred lines. (c) Synteny plot between maize and sorghum chromosomes. Yellow lines represent the chromosomes of the maize B73 line, brown lines represent the chromosomes of sorghum, and the red connecting lines indicate syntenic gene pairs between the two species.
Figure 6
Figure 6
Expression patterns, GO enrichment, and protein interaction network of PHT family members. (a) Expression profile analysis based on FPKM RNA-seq data. PR_6d_GH: Primary_Root_6_days_after_sowing_GH; WPR_7d: Whole_Primary_Root_7d; SR_7-8d: Secondary_Root_7_8_Days; Salt_Seedlings: Salt_treated_seedlings; Heat_Seedlings: heat-treated seedling; V3_Top_Leaf: V3_Topmost_leaf; V5_Tip_Leaf: V5_Tip_of_Stage_2_Leaf; V7_Tip_Trans_Leaf: V7_Tip_of_transition_leaf; LZ1_Symm: Leaf_Zone_1_Symmetrical; LZ2_Stoma: Leaf_Zone_2_Stomatal; LZ3_Growth: Leaf_Zone_3_Growth. The numbers in the heatmaps represent TPM values. (b) Transcriptome principal component analysis (PCA) of ZmPHT genes family members, with a PCA plot showing four groups: LP-P1, LP-P2, NP-P1, and NP-P2. Principal Component 1 (Dim 1) and Principal Component 2 (Dim 2) account for the majority of the variation in the data. (c) Expression profile analysis based on FPKM RNA-seq data. LP: low-phosphorus condition; NP: normal-phosphorus condition; P1: phosphorus-sensitive line; P2: phosphorus-tolerant line. The numbers in the heatmaps represent TPM values. (d) GO enrichment pathways of PHT genes. (e) Protein–protein interaction (PPI) network of PHT family members. The central node is the ZmPHT2-1 gene. The connections represent interactions between genes.

Similar articles

References

    1. Raghothama K.G. Phosphate Acquisition. Annu. Rev. Plant Physiol. Plant Mol. Biol. 1999;50:665–693. doi: 10.1146/annurev.arplant.50.1.665. - DOI - PubMed
    1. Mehta D., Ghahremani M., Pérez-Fernández M., Tan M., Schläpfer P., Plaxton W.C., Uhrig R.G. Phosphate and phosphite have a differential impact on the proteome and phosphoproteome of Arabidopsis suspension cell cultures. Plant J. 2021;105:924–941. doi: 10.1111/tpj.15078. - DOI - PubMed
    1. Li P., Ma X., Wang J., Yao L., Li B., Meng Y., Si E., Yang K., Shang X., Zhang X., et al. Integrated Analysis of Metabolome and Transcriptome Reveals Insights for Low Phosphorus Tolerance in Wheat Seedling. Int. J. Mol. Sci. 2023;24:14840. doi: 10.3390/ijms241914840. - DOI - PMC - PubMed
    1. Bechtaoui N., Rabiu M.K., Raklami A., Oufdou K., Hafidi M., Jemo M. Phosphate-Dependent Regulation of Growth and Stresses Management in Plants. Front. Plant Sci. 2021;12:679916. doi: 10.3389/fpls.2021.679916. - DOI - PMC - PubMed
    1. Oukaltouma K., Moukhtari A.E., Lahrizi Y., Mouradi M., Farissi M., Willems A., Qaddoury A., Bekkaoui F., Ghoulam C. Phosphorus deficiency enhances water deficit impact on some morphological and physiological traits in four faba bean (Vicia faba L.) varieties. Ital. J. Agron. 2021;16:1662. doi: 10.4081/ija.2020.1662. - DOI

LinkOut - more resources