

LCAT in Cancer Biology: Embracing Epigenetic Regulation, Immune Interactions, and Therapeutic Implications
- PMID: 40003919
- PMCID: PMC11855027
- DOI: 10.3390/ijms26041453
LCAT in Cancer Biology: Embracing Epigenetic Regulation, Immune Interactions, and Therapeutic Implications
Abstract
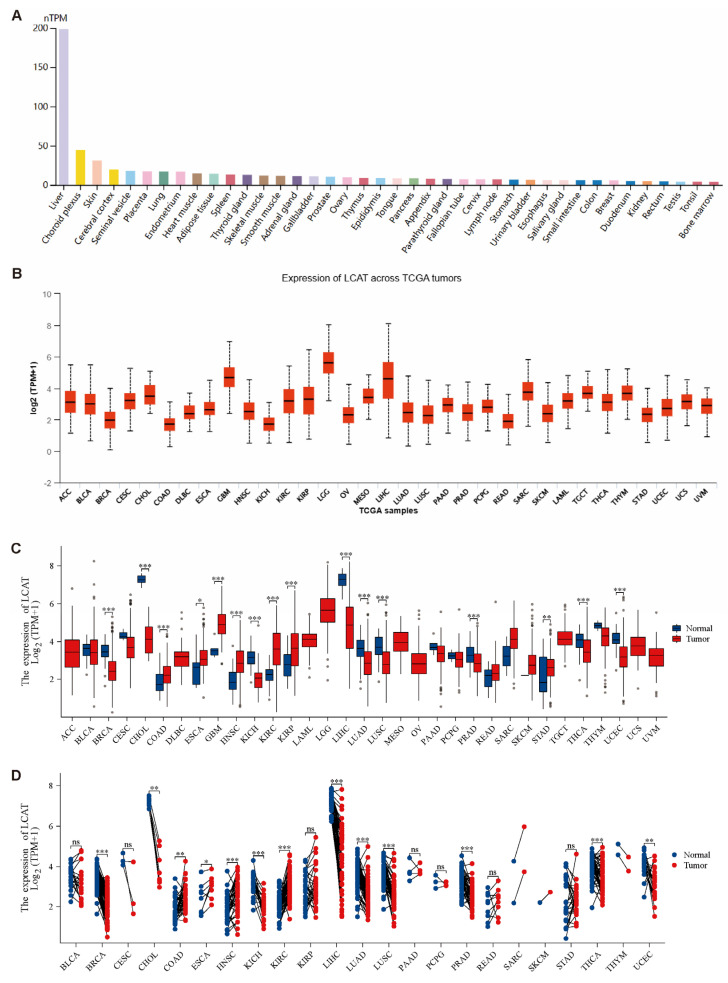
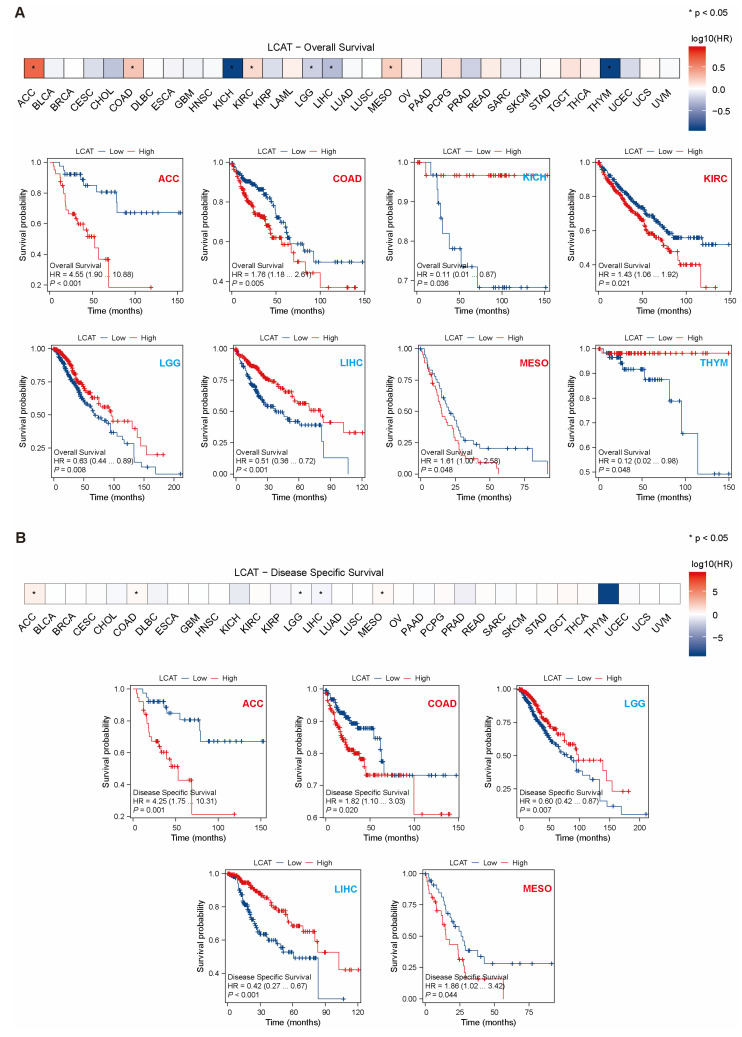
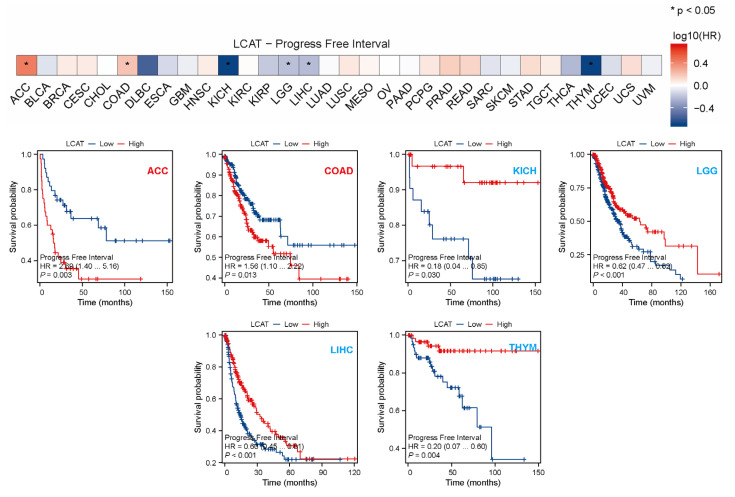
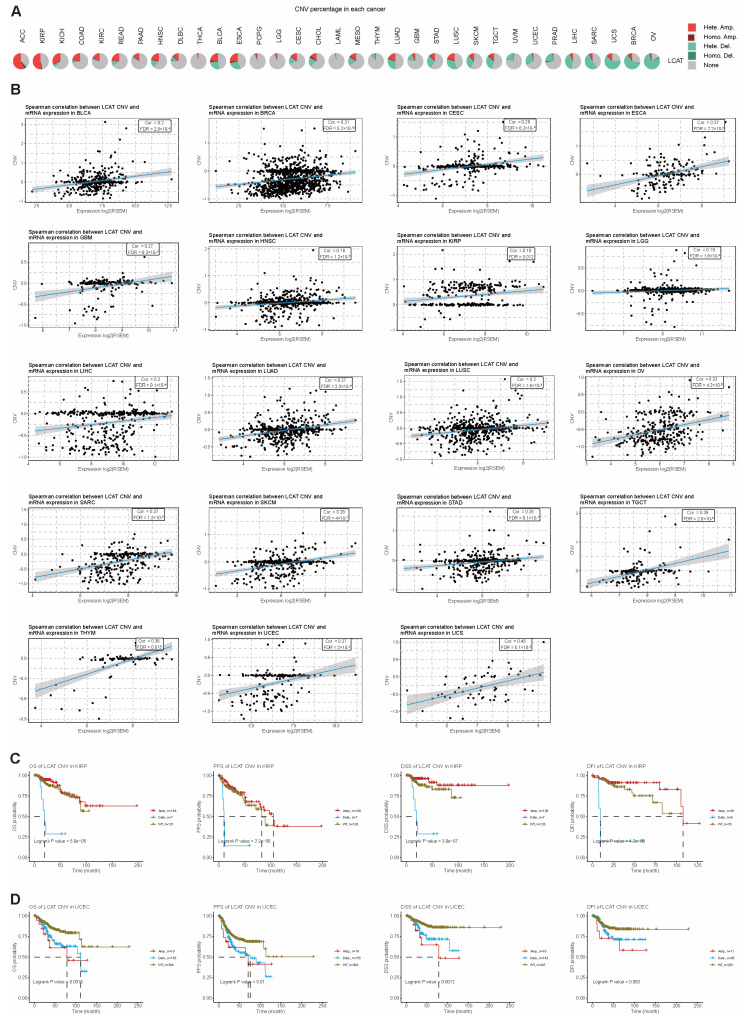
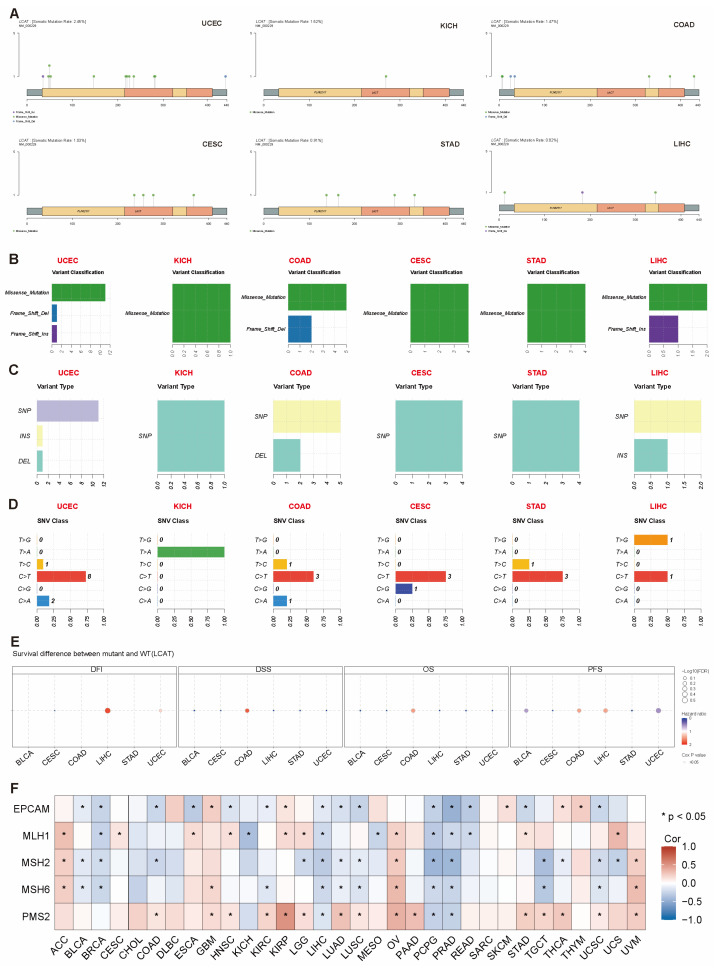
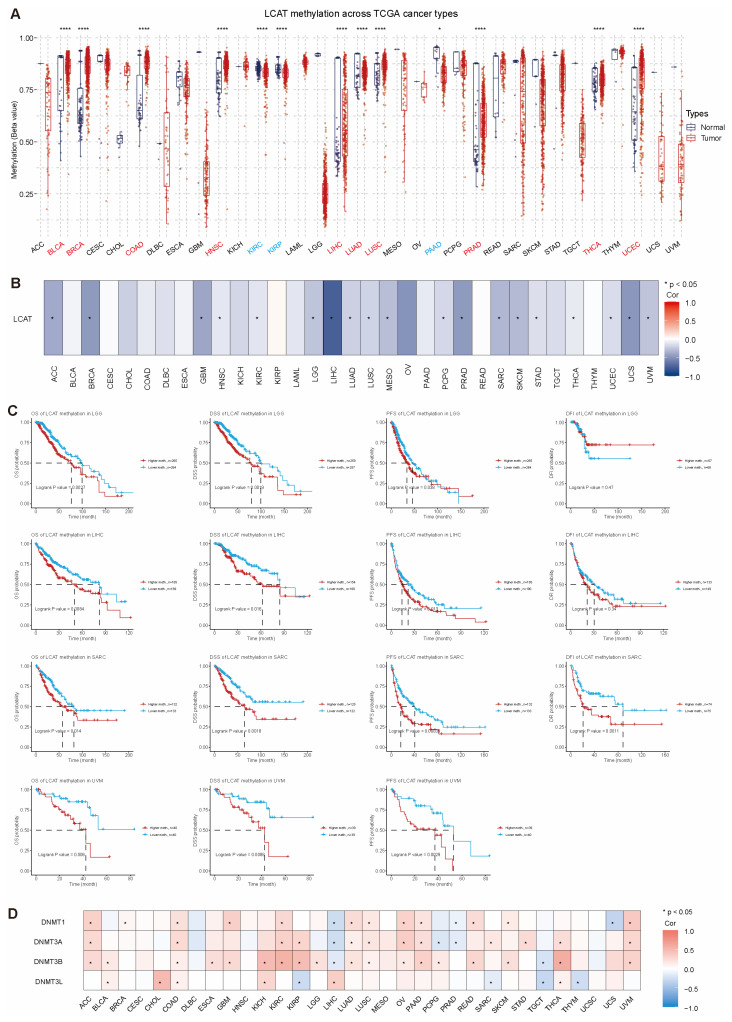
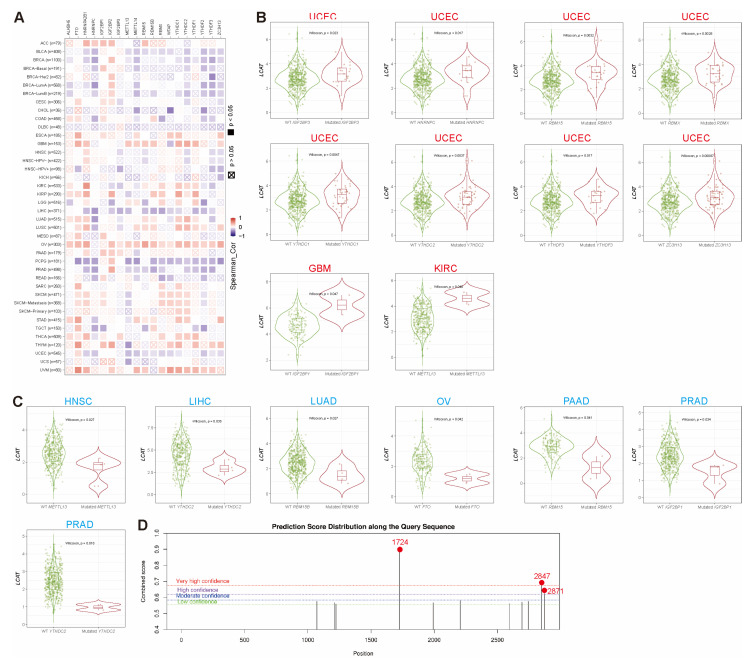
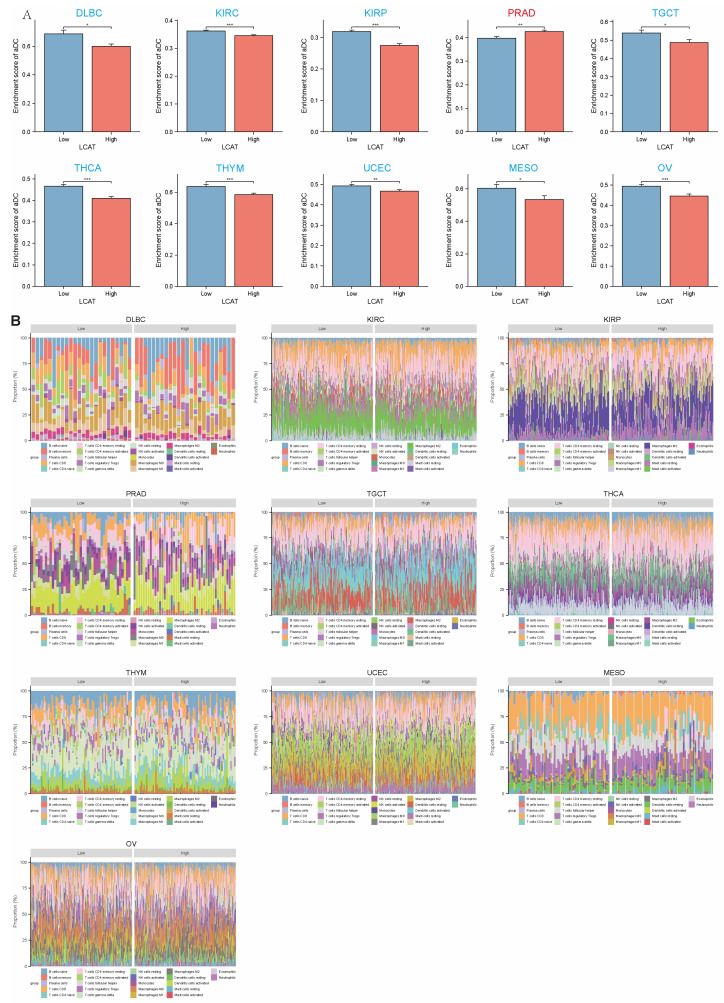
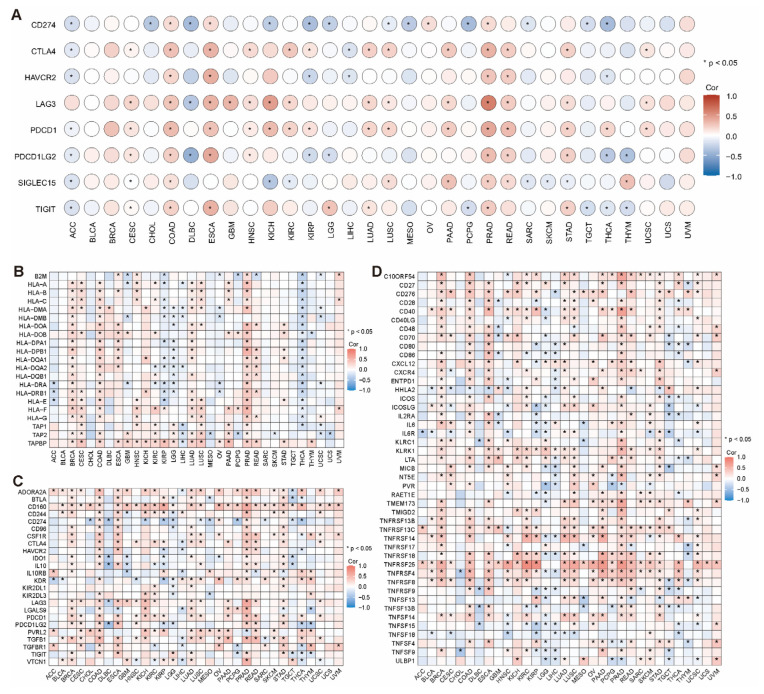
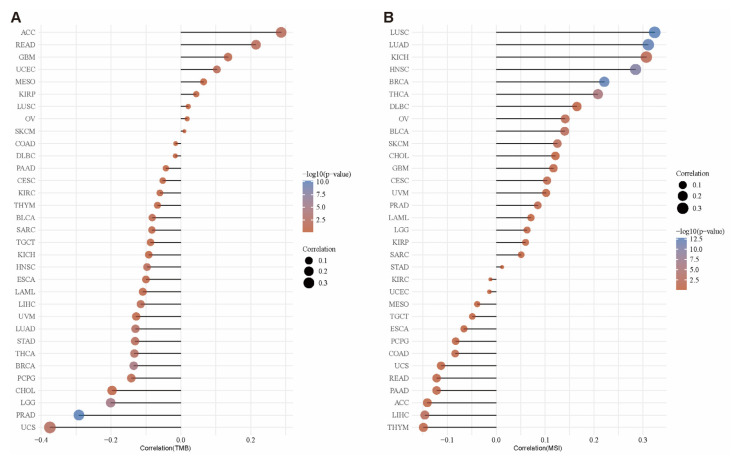
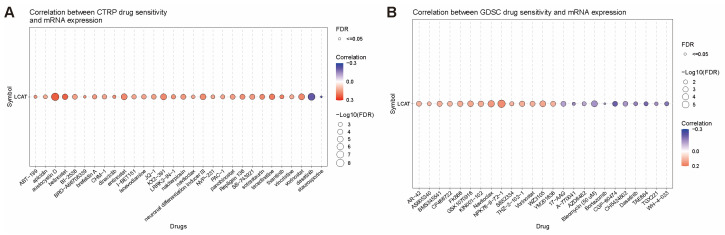
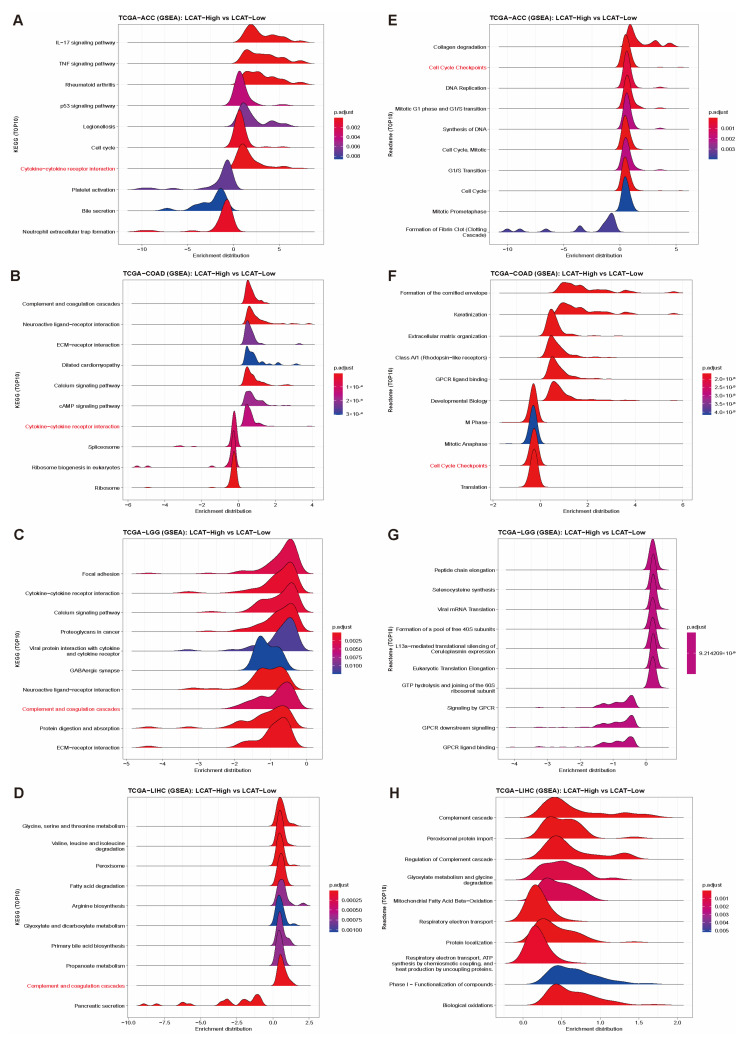
Lecithin cholesterol acyltransferase (LCAT) is a crucial enzyme in high-density lipoprotein (HDL) metabolism that is often dysregulated in cancers, affecting tumor growth and therapy response. We extensively studied LCAT expression in various malignancies, linking it to clinical outcomes and genetic/epigenetic alterations. We analyzed LCAT expression in multiple cancers and used the Cox regression model to correlate it with patient survival metrics, including overall survival (OS), disease-specific survival (DSS), and progression-free interval (PFI). We also examined the copy number variations (CNVs), single-nucleotide variations (SNVs), DNA methylation, and N6-methyladenosine (m6A) modifications of LCAT and their connections to tumor immune responses and drug sensitivity. LCAT expression varies among cancers and correlates with patient outcomes. Low expression is linked to poor prognosis in low-grade glioma (LGG) and liver hepatocellular carcinoma (LIHC), while high expression is associated with better outcomes in adrenocortical carcinoma (ACC) and colon adenocarcinoma (COAD). In kidney renal papillary cell carcinoma (KIRP) and uterine corpus endometrial carcinoma (UCEC), LCAT CNV and methylation levels are prognostic markers. LCAT interacts with m6A modifiers and immune molecules, suggesting a role in immune evasion and as a biomarker for immunotherapy response. LCAT expression correlates with chemotherapeutic drug IC50 values, indicating potential for predicting treatment response. In ACC and COAD, LCAT may promote tumor growth, while in LGG and LIHC, it may inhibit progression. LCAT expression and activity regulation could be a new cancer therapy target. As a key molecule linking lipid metabolism, immune modulation, and tumor progression, the potential of LCAT in cancer therapy is significant. Our findings provide new insights into the role of LCAT in cancer biology and support the development of personalized treatment strategies.
Keywords: HDL; LCAT; cancer metabolism; epigenetic alterations; immune modulation; personalized cancer therapy.
Conflict of interest statement
The authors declare no conflicts of interest.
Figures
Similar articles
-
Pan-Cancer Analysis of PARP1 Alterations as Biomarkers in the Prediction of Immunotherapeutic Effects and the Association of Its Expression Levels and Immunotherapy Signatures.Front Immunol. 2021 Aug 31;12:721030. doi: 10.3389/fimmu.2021.721030. eCollection 2021. Front Immunol. 2021. PMID: 34531868 Free PMC article.
-
Identifies microtubule-binding protein CSPP1 as a novel cancer biomarker associated with ferroptosis and tumor microenvironment.Comput Struct Biotechnol J. 2022 Jun 24;20:3322-3335. doi: 10.1016/j.csbj.2022.06.046. eCollection 2022. Comput Struct Biotechnol J. 2022. PMID: 35832625 Free PMC article.
-
Estrogen Induces LCAT to Maintain Cholesterol Homeostasis and Suppress Hepatocellular Carcinoma Development.Cancer Res. 2024 Aug 1;84(15):2417-2431. doi: 10.1158/0008-5472.CAN-23-3966. Cancer Res. 2024. PMID: 38718297
-
A review on lecithin:cholesterol acyltransferase deficiency.Clin Biochem. 2015 May;48(7-8):472-5. doi: 10.1016/j.clinbiochem.2014.08.014. Epub 2014 Aug 27. Clin Biochem. 2015. PMID: 25172171 Review.
-
The role of lecithin:cholesterol acyltransferase in the modulation of cardiometabolic risks - a clinical update and emerging insights from animal models.Biochim Biophys Acta. 2012 Apr;1821(4):654-9. doi: 10.1016/j.bbalip.2011.12.012. Epub 2012 Jan 12. Biochim Biophys Acta. 2012. PMID: 22326749 Review.
Cited by
-
Metabolic reprogramming in hepatocellular carcinoma: an integrated omics study of lipid pathways and their diagnostic potential.J Transl Med. 2025 Jun 11;23(1):644. doi: 10.1186/s12967-025-06698-7. J Transl Med. 2025. PMID: 40500772 Free PMC article.
References
-
- Seguret-Mace S., Latta-Mahieu M., Castro G., Luc G., Fruchart J.C., Rubin E., Denefle P., Duverger N. Potential gene therapy for lecithin-cholesterol acyltransferase (LCAT)-deficient and hypoalphalipoproteinemic patients with adenovirus-mediated transfer of human LCAT gene. Circulation. 1996;94:2177–2184. doi: 10.1161/01.CIR.94.9.2177. - DOI - PubMed
Publication types
MeSH terms
Substances
Grants and funding
LinkOut - more resources
Full Text Sources
Medical
Research Materials
Miscellaneous
