Review
. 2025 Feb 11;26(4):1504.
doi: 10.3390/ijms26041504.

Evaluation of Small-Molecule Candidates as Modulators of M-Type K+ Currents: Impacts on Current Amplitude, Gating, and Voltage-Dependent Hysteresis

Affiliations
Review

Evaluation of Small-Molecule Candidates as Modulators of M-Type K+ Currents: Impacts on Current Amplitude, Gating, and Voltage-Dependent Hysteresis

Te-Ling Lu et al. Int J Mol Sci. .

Abstract

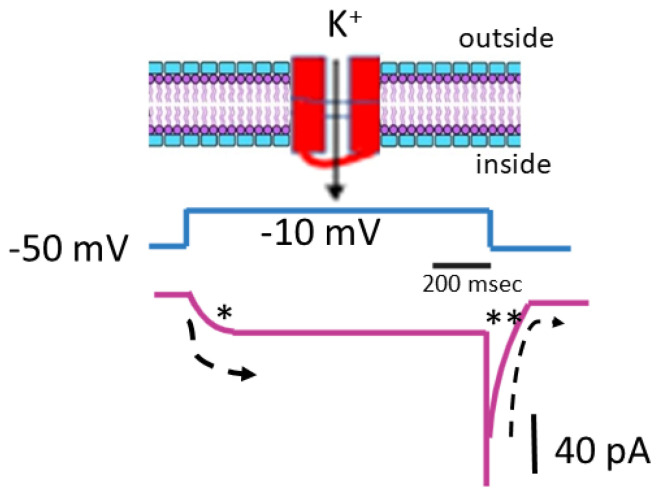
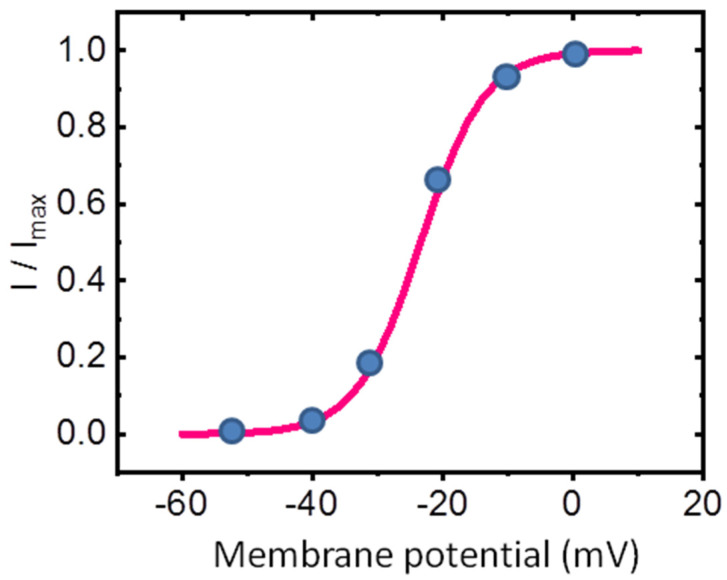
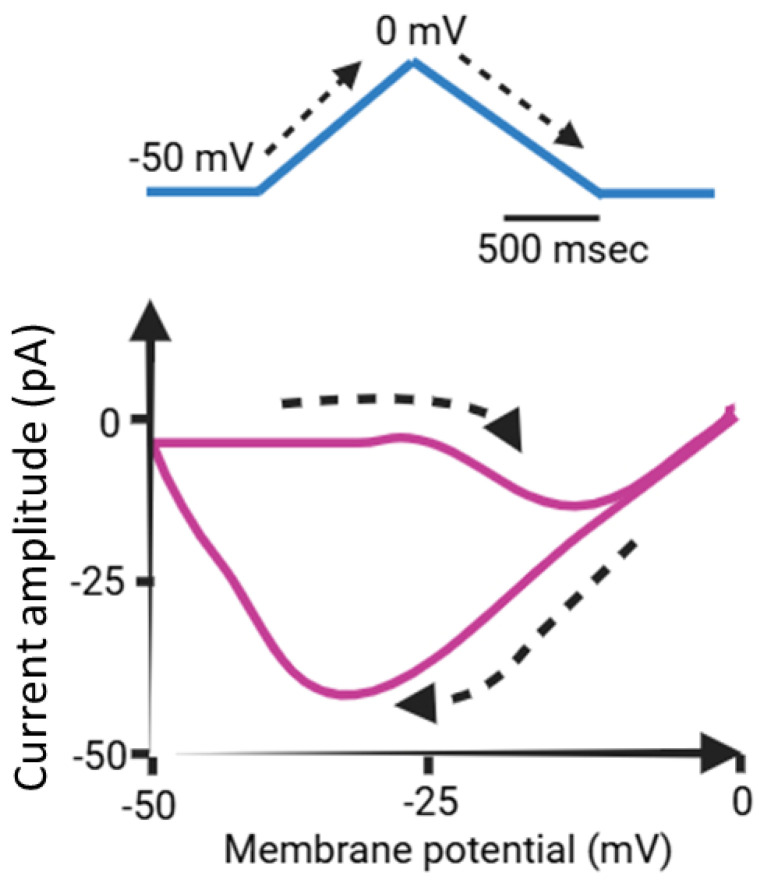
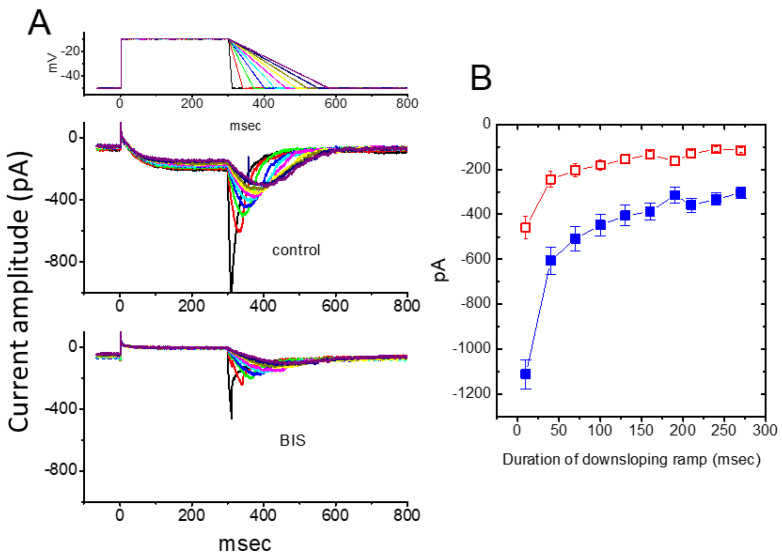
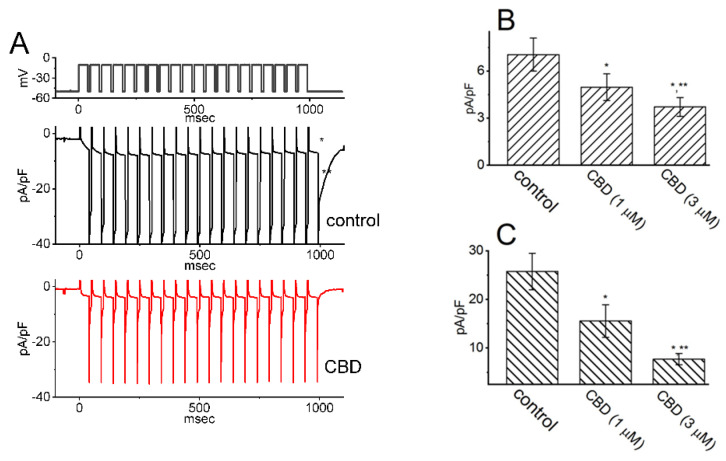
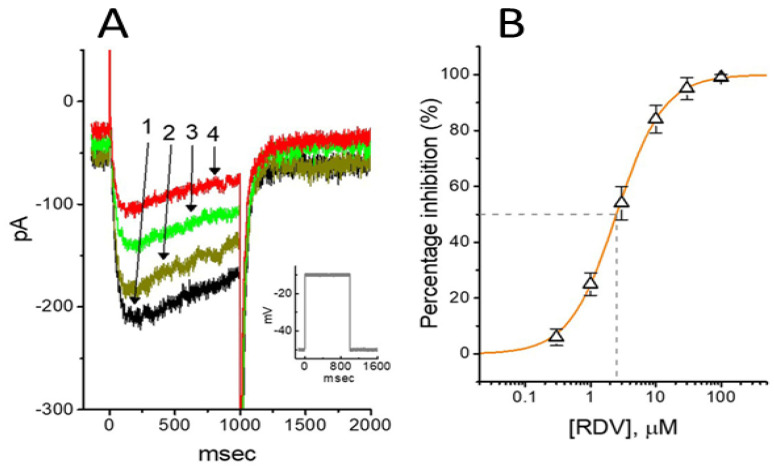
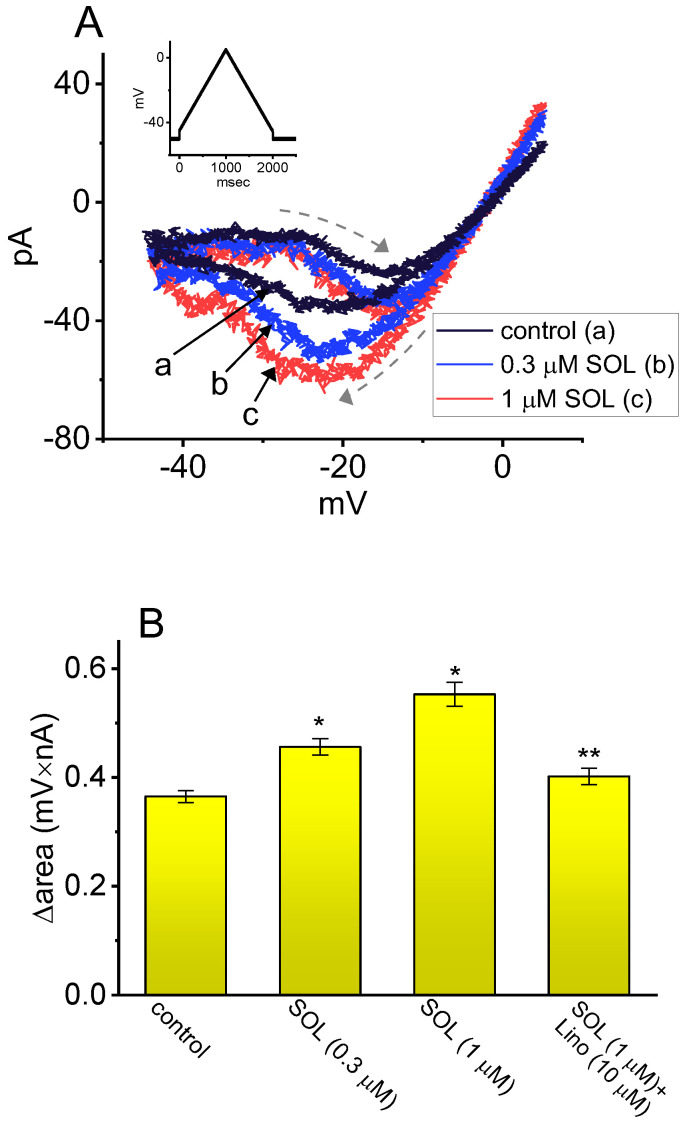
The core subunits of the KV7.2, KV7.3, and KV7.5 channels, encoded by the KCNQ2, KCNQ3, and KCNQ5 genes, are expressed across various cell types and play a key role in generating the M-type K+ current (IK(M)). This current is characterized by an activation threshold at low voltages and displays slow activation and deactivation kinetics. Variations in the amplitude and gating kinetics of IK(M) can significantly influence membrane excitability. Notably, IK(M) demonstrates distinct voltage-dependent hysteresis when subjected to prolonged isosceles-triangular ramp pulses. In this review, we explore various small-molecule modulators that can either inhibit or enhance the amplitude of IK(M), along with their perturbations on its gating kinetics and voltage-dependent hysteresis. The inhibitors of IK(M) highlighted here include bisoprolol, brivaracetam, cannabidiol, nalbuphine, phenobarbital, and remdesivir. Conversely, compounds such as flupirtine, kynurenic acid, naringenin, QO-58, and solifenacin have been shown to enhance IK(M). These modulators show potential as pharmacological or therapeutic strategies for treating certain disorders linked to gain-of-function or loss-of-function mutations in M-type K+ (KV7x or KCNQx) channels.

Keywords: M-type (KV7x or KCNQx) channel; M-type K+ current; current kinetics; small-molecule modulator.


Conflict of interest statement

The authors declare no conflicts of interests that are directly relevant to this work. The content and writing of this paper are solely the responsibility of the authors.

Figures

Figure 1
Figure 1
Biophysical characteristics of the M-type K+ current (IK(M)) present in pituitary GH3 cells. The cells were immersed in a high-K+ (145 mM) Ca2+-free solution with a reversal potential of around 0 mV, while we filled the recording pipette with a K+-enriched solution. The top diagram depicts a simplified schematic representation of a cell membrane (lipid bilayer) containing a KM (KV7x or KCNQx) K+ channel. The solid arrow in the top diagram points to the activation of IK(M) in response to membrane depolarization, with K+ ions moving inward. The middle diagram shows the voltage-clamp protocol (indicated in black), where the holding potential was set to −50 mV, and a depolarizing pulse was applied from −50 to −10 mV for a duration of 1 s. The bottom diagram represents a schematic representation of the IK(M) trace (indicated in purple). The asterisk (*) marks the activation phase of the current, while the double asterisk (**) indicates the deactivation phase. The dashed curve illustrates the activation and deactivation time courses of IK(M) in response to membrane depolarization.
Figure 2
Figure 2
Steady-state activation curve of IK(M) in GH3 cells. The activation curve of IK(M) was derived from GH3 cells bathed in a high-K+ Ca2+-free solution. The relationship between membrane potential and normalized IK(M) is depicted. The current amplitude was measured at the end of a 1 − s depolarizing pulse. The solid blue circles represent the normalized IK(M) values recorded at each test voltage. The smooth sigmoidal red curve, generated by fitting the data points to the Boltzmann equation detailed in the text, highlights the voltage-dependent activation of IK(M), particularly at low voltages.
Figure 3
Figure 3
Simplified graphic representation of voltage-dependent hysteresis (Hys(V)) in IK(M). The upper panel illustrates a schematic of a prolonged upright isosceles-triangular waveform, representing a double ramp voltage (Vramp) protocol applied over 2 s. The lower panel shows the relationship between voltage and whole-cell IK(M), emphasizing the Hys(V) behavior, highlighted in purple. The dashed black lines in the upper and lower panels indicate the trajectories of the applied potential and the resulting current trace over time, respectively.
Figure 4
Figure 4
Effect of BIS on the deactivating tail IK(M) during repolarizing phases with varying durations (109–280 ms) to simulate different repolarizing slopes of bursting action potential patterns. (A) Representative current traces recorded in response to the voltage protocol shown in the topmost panel, obtained in the absence (upper) and presence (lower) of 10 μM BIS. The topmost panel indicates the applied voltage protocol. The different colors in current traces correspond with those in the voltage-clamp protocols shown at the topmost panel. (B) Effect of BIS on the peak amplitude of deactivating IK(M) upon return to −50 mV with different falling phase durations (mean ± SEM; n = 11 for each point). The peak amplitude indicated at each point was measured at various falling phase durations. ■: control (in the absence of BIS); □: in the presence of 3 μM BIS. This figure is adapted from So et al. [56] and published under the terms and conditions of the Creative Commons Attribution (CC BY) license.
Figure 5
Figure 5
Effect of CBD on the activation of IK(M) through pulse-train stimulation in GH3 cells. To perform the experiment, cells were placed in a high-K+, Ca2+-free solution, and the pulse-train stimulation protocol involved a series of 40 depolarizing pulses lasting 20 ms each, applied at −10 mV with 5 ms intervals, for a total duration of 1 s. (A) Representative current traces acquired during the control period (upper trace in black) and in the presence of 3 μM CBD (lower trace in red). The top portion of the figure shows the voltage-clamp protocol applied. The * symbol in the middle portion of the figure indicates the activating IK(M), while ** represents the deactivating (or tail) component of IK(M) obtained after returning to −50 mV. Summary bar graphs in (B,C) display the activating and deactivating densities of IK(M), respectively, in the absence and presence of 1 or 3 μM CBD. The values are presented as mean ± SEM, with each bar representing data from seven independent experiments. The activating density of IK(M) was measured at the end of the pulse-train stimuli from −50 to −10 mV, while the deactivating density was measured following the return to −50 mV. The * symbol indicates statistical significance when compared to the control group (p < 0.05), while ** denotes statistical significance when compared to the CBD (1 μM) alone group (p < 0.05). This figure is adapted from Liu et al. [76] and published under the terms and conditions of the Creative Commons Attribution (CC BY) license.
Figure 6
Figure 6
Effect of RDV on IK(M) in GH3 cells. The experiments were conducted in cells immersed in high-K+, Ca2+-free solution, and the pipette used was filled with K+-containing solution. (A) Reprsentative IK(M) traces elicited by 1 − s step depolarization from −50 to −10 mV (indicated in inset). The current trace labeled 1 is the control, and that labeled 2, 3, or 4 was obtained after the addition of 0.3 μM RDV, 1 μM RDV, or 3 μM RDV, respectively. (B) Concentration-dependent inhibition of RDV on IK(M) amplitude in GH3 cells (mean ± SEM; n = 9). Current amplitude was measured at the end of the 1 − s depolarizing pulse. The continuous line was fitted by a Hill function. The IC50 value (as indicated in the vertical dashed line) needed for an RDV-induced decrease in IK(M) was 2.5 μM. This figure is adapted from Chang et al. [101] and published under the terms and conditions of the Creative Commons Attribution (CC BY) license.
Figure 7
Figure 7
Stimulatory effect of SOL on voltage-dependent hysteresis (Hys(V)) of IK(M) in GH3 cells. This series of experiments was conducted with an isosceles-triangular Vramp. (A) Representative current traces evoked by isosceles-triangular Vramp for a duration of 2 s obtained in the control period (a, black) and during the exposure to 0.3 μM SOL (b, blue) or 1 μM SOL (c, red). The dashed arrows indicate the distinctive patterns of current trajectory by which time passes as Vramp is applied. The voltage-clamp pulse is illustrated in inset at the left upper corner. (B) Hysteretic area (i.e., Δarea of IK(M)’s Hys(V) obtained in control period (i.e., SOL was not present) or during exposure to SOL and SOL plus linopirdine (Lino). The area encircled by current amplitudes activated in the ascending and descending limbs at the voltages between −45 and 0 mV was calculated. Each bar indicates the mean ± SEM (n = 7 for each bar). The * symbol indicates statistical significance when compared to the control group (p < 0.05), while ** denotes statistical significance when compared to the SOL (0.3 μM) alone group (p < 0.05). This figure is adapted from Cho et al. [21] and published under the terms and conditions of the Creative Commons Attribution (CC BY) license.

Similar articles

References

    1. Miceli F., Soldovieri M.V., Martire M., Taglialatela M. Molecular pharmacology and therapeutic potential of neuronal Kv7-modulating drugs. Curr. Opin. Pharmacol. 2008;8:65–74. doi: 10.1016/j.coph.2007.10.003. - DOI - PubMed
    1. Dossi E., Zonca L., Pivonkova H., Milior G., Moulard J., Vargova L., Chever O., Holcman D., Rouach N. Astroglial gap junctions strengthen hippocampal network activity by sustaining afterhyperpolarization via KCNQ channels. Cell Rep. 2024;43:114158. doi: 10.1016/j.celrep.2024.114158. - DOI - PubMed
    1. Graziano B., Wang L., White O.R., Kaplan D.H., Fernandez-Abascal J., Bianchi L. Glial KCNQ K+ channels control neuronal output by regulating GABA release from glia in C. elegans. Neuron. 2024;112:1832–1847.e7. doi: 10.1016/j.neuron.2024.02.013. - DOI - PMC - PubMed
    1. Sankaranarayanan S., Simasko S.M. Characterization of an M-like current modulated by thyrotropin-releasing hormone in normal rat lactotrophs. J. Neurosci. 1996;16:1668–1678. doi: 10.1523/JNEUROSCI.16-05-01668.1996. - DOI - PMC - PubMed
    1. Selyanko A.A., Brown D.A. M-channel gating and simulation. Biophys. J. 1999;77:701–713. doi: 10.1016/S0006-3495(99)76925-0. - DOI - PMC - PubMed

MeSH terms

Substances

LinkOut - more resources