. 2025 Feb 12;26(4):1551.
doi: 10.3390/ijms26041551.

A Novel Prognostic Signature of Mitophagy-Related E3 Ubiquitin Ligases in Breast Cancer

Affiliations

A Novel Prognostic Signature of Mitophagy-Related E3 Ubiquitin Ligases in Breast Cancer

Kangjing Bian et al. Int J Mol Sci. .

Abstract

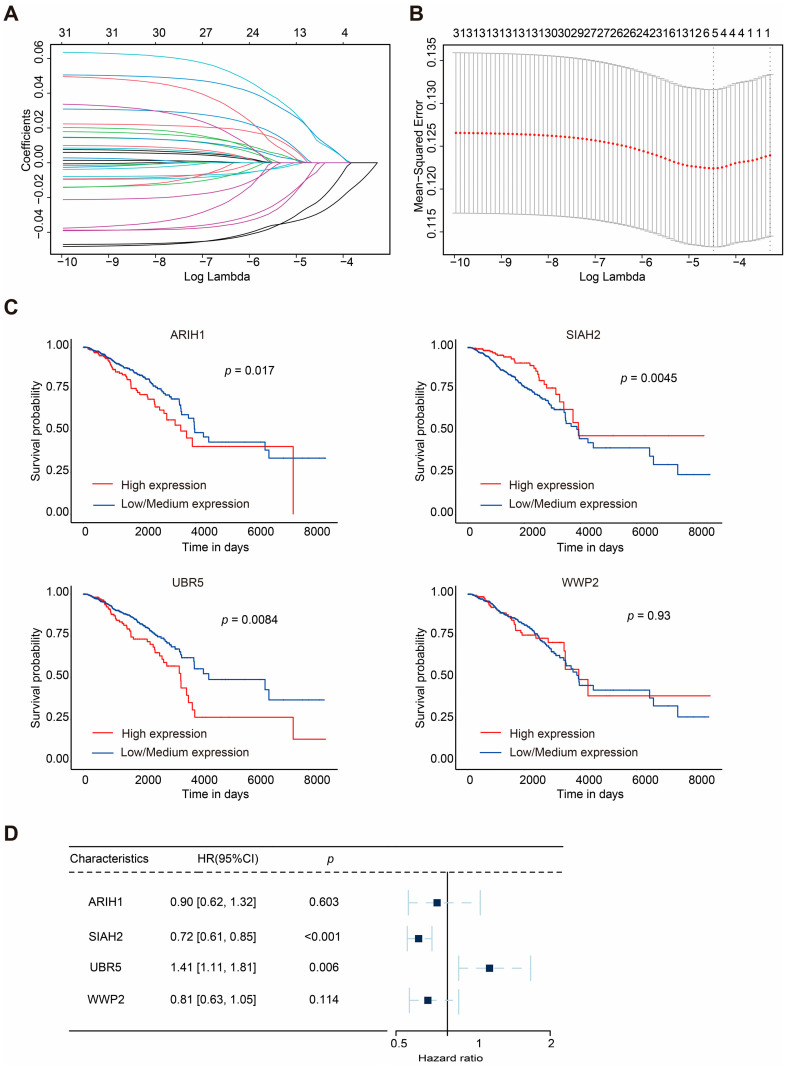
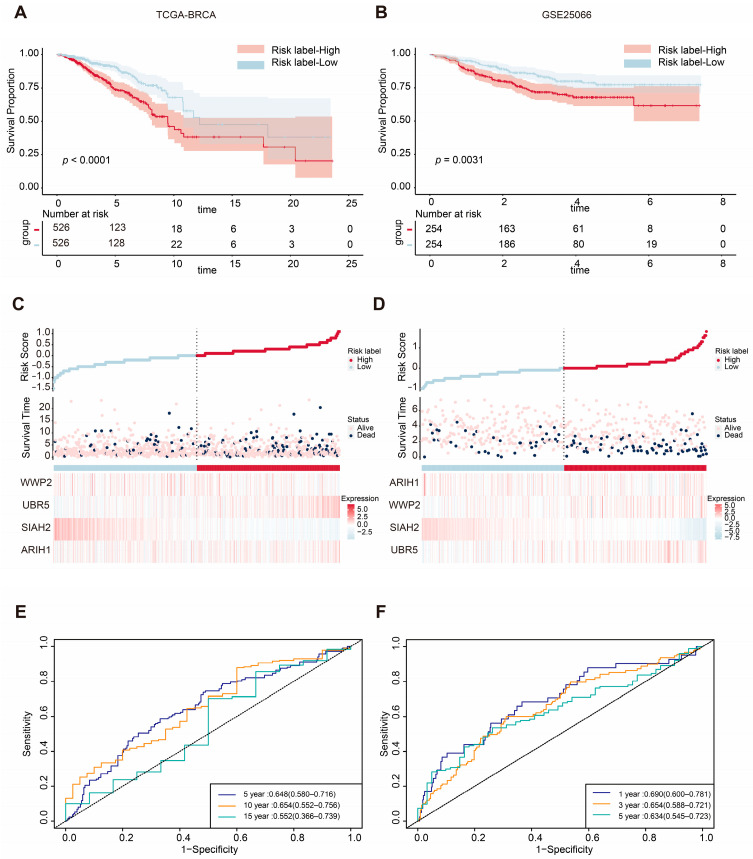
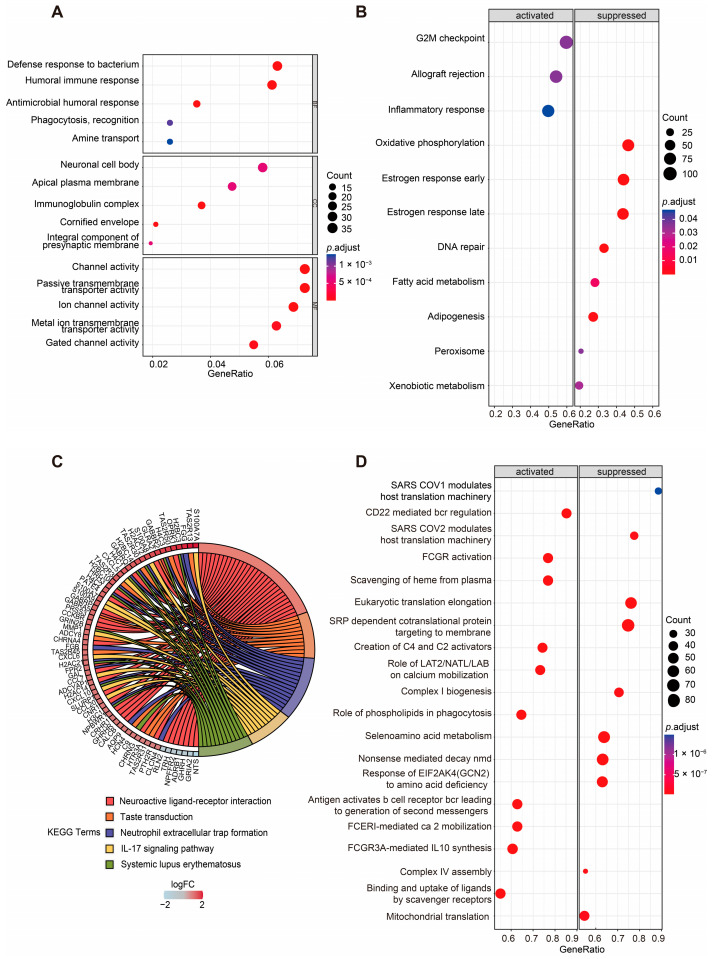
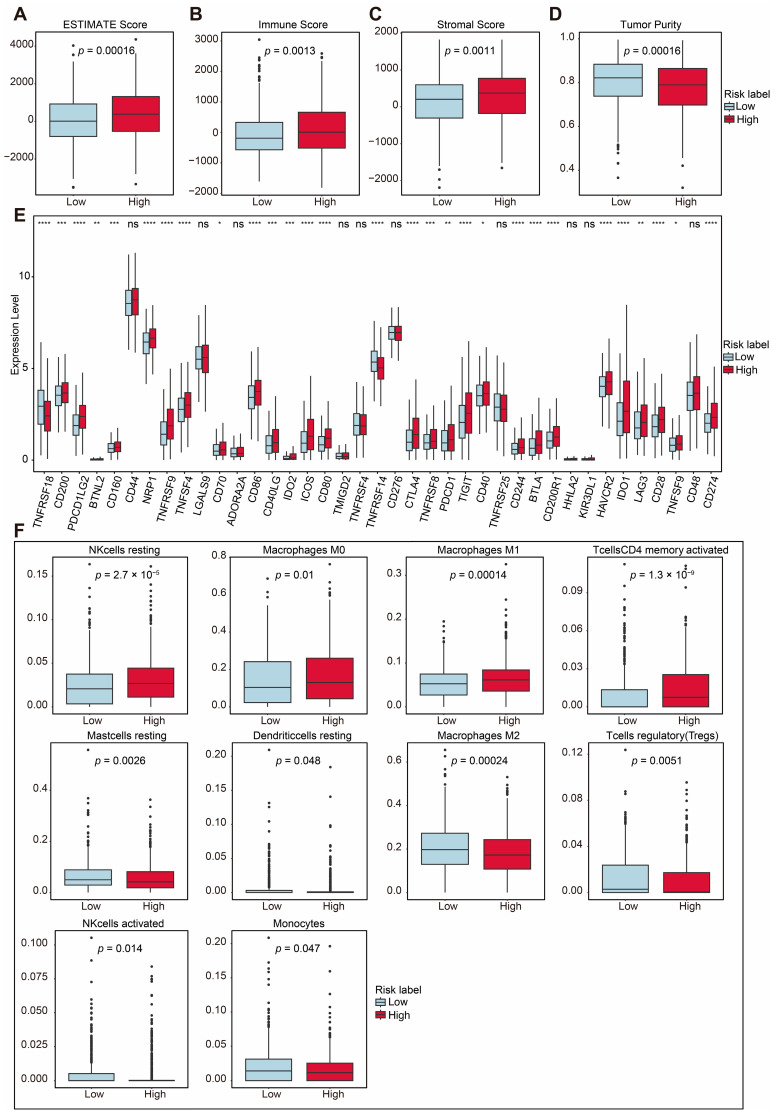
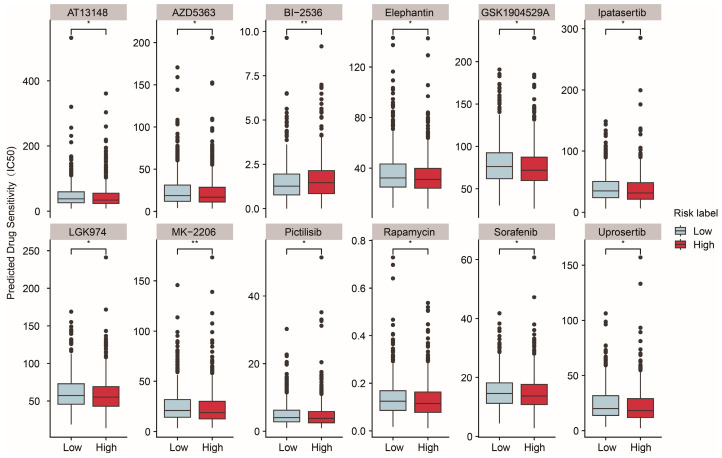
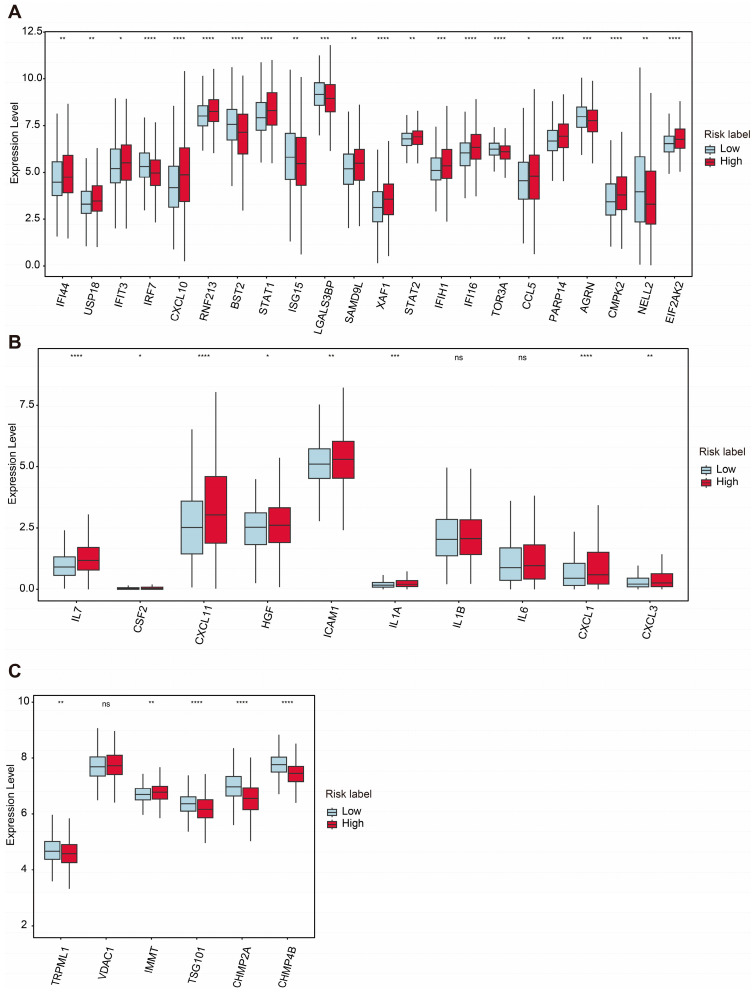
Mitophagy plays a critical role in maintaining mitochondrial quality and cellular homeostasis. But the specific contribution of mitophagy-related E3 ubiquitin ligases to prognoses remains largely unexplored. In this study, we identified a novel mitophagy-related E3 ubiquitin ligase prognostic signature using least absolute shrinkage and selector operator (LASSO) and multivariate Cox regression analyses in breast cancer. Based on median risk scores, patients were divided into high-risk and low-risk groups. Functional enrichment analyses were conducted to explore the biological differences between the two groups. Immune infiltration, drug sensitivity, and mitochondrial-related phenotypes were also analyzed to evaluate the clinical implications of the model. A four-gene signature (ARIH1, SIAH2, UBR5, and WWP2) was identified, and Kaplan-Meier analysis demonstrated that the high-risk group had significantly worse overall survival (OS). The high-risk patients exhibited disrupted mitochondrial metabolism and immune dysregulation with upregulated immune checkpoint molecules. Additionally, the high-risk group exhibited higher sensitivity to several drugs targeting the Akt/PI3K/mTORC1 signaling axis. Accompanying mitochondrial metabolic dysregulation, mtDNA stress was elevated, contributing to activation of the senescence-associated secretory phenotype (SASP) in the high-risk group. In conclusion, the identified signature provides a robust tool for risk stratification and offers insights into the interplay between mitophagy, immune modulation, and therapeutic responses for breast cancer.

Keywords: E3 ubiquitin ligase; breast cancer; immune; metabolic; mitophagy; prognostic signature.


Conflict of interest statement

The authors declare no conflicts of interest.

Figures

Figure 1
Figure 1
Workflow diagram, showing the flowchart graph of this research.
Figure 2
Figure 2
LASSO regression and clinical analyses of prognostic model in breast cancer. (A,B) Results of LASSO regression analysis. (C) Kaplan–Meier survival curves of 4 mitophagy-related E3 ubiquitin ligases (ARIH1, SIAH2, UBR5, and WWP2) in BRCA. (D) Multivariate Cox regression analysis of the four selected E3 ubiquitin ligases (ARIH1, SIAH2, UBR5, and WWP2). HRs with 95% CI are displayed. The square represents the HR, and the dashed line indicates 95% CI.
Figure 3
Figure 3
Validation of the ASUW prognostic model in TCGA-BRCA and GSE25066 databases. (A,B) Kaplan–Meier survival curves for high-risk and low-risk groups in the TCGA-BRCA cohort and GSE25066 cohort, based on the ASUW risk regression model. (C,D) The distribution of the risk scores, with scatter plots showing whether the samples were alive and heatmaps for the four E3 ubiquitin ligases in the TCGA-BRCA cohort and GSE25066 cohort. Top: Risk scores for each patient, classified as high-risk (red) and low-risk (blue) groups. Middle: Survival time and status (alive or dead). Bottom: Heatmaps of expression levels of the four E3 ubiquitin ligases in two groups. (E) ROC curve analysis for 5-, 10-, and 15-year survival predictions in the TCGA-BRCA cohort. (F) ROC curve analysis for 1-, 3-, and 5-year survival predictions in the GSE25066 cohort.
Figure 4
Figure 4
Enrichment analyses of DEGs of two groups. (A) GO enrichment analysis of DEGs between the high- and low-risk groups based on the ASUW model. The size of the dots indicates the ratio of genes enriched, while the colors represent the adjusted p value. (B) GSEA of “Hallmark gene sets” between high-risk and low-risk groups. Significant pathways were categorized as activated (left panel) or suppressed (right panel). The size of the dots represents the ratio of enriched genes, while the color indicates the adjusted p value. (C) KEGG enrichment analysis of DEGs. A chord diagram demonstrates the associations between the 5 most enriched KEGG pathways and the corresponding genes. The colors of the bands correspond to log (foldchange (FC)) values, showing upregulated (red) and downregulated (blue) genes in the high-risk group. (D) GSEA of “Reactome gene sets” between high-risk and low-risk groups. Significant pathways were categorized as activated (left panel) or suppressed (right panel). The size of the dots represents the ratio of enriched genes, while the color indicates the adjusted p value.
Figure 5
Figure 5
Immune-related analysis between two groups. (A) Total ESTIMATE score, indicating tumor purity and immune-stromal component differences (p = 0.00016). (B) Immune score, indicating immune infiltration differences (p = 0.0013). (C) Stromal score, indicating stromal content differences (p = 0.0011). (D) Tumor purity score, indicating tumor purity differences (p = 0.00016). (E) Comparison of immune checkpoint-related gene expression between the two risk groups. (F) Proportions of immune cell types with significant differences between high- and low-risk groups. Statistical significance is indicated as not significant (ns). * p < 0.05. ** p < 0.01. *** p < 0.001. **** p < 0.0001.
Figure 6
Figure 6
Predicted drug sensitivity differences between two groups. The boxplots depict the predicted drug sensitivity (IC50) of 12 drugs between the high-risk (red) and low-risk (blue) groups as predicted by oncoPredict analysis. Drugs exhibiting statistically significant differences in sensitivity (p < 0.05) are shown. The high-risk group displayed higher sensitivity to drugs including MK-2206, pictilisib, rapamycin, sorafenib, GSK1904529A, uprosertib, LGK974, elephantin, AZD5363, ipatasertib, and AT13148. Conversely, the low-risk group demonstrated greater sensitivity to BI-2536. Statistical significance is indicated as * p < 0.05. ** p < 0.01.
Figure 7
Figure 7
Comparative expression analysis of mtDNA stress and SASP- and VDIM-related genes between two groups. (A) Differential expression levels of mtDNA stress-related genes between high- and low-risk groups. (B) Differential expression levels of SASP-related genes. (C) Differential expression levels of critical proteins involved in the VDIM process. Statistical significance is indicated as not significant (ns). * p < 0.05. ** p < 0.01. *** p < 0.001. **** p < 0.0001.

Similar articles

References

    1. Hong R., Xu B. Breast cancer: An up-to-date review and future perspectives. Cancer Commun. 2022;42:913–936. doi: 10.1002/cac2.12358. - DOI - PMC - PubMed
    1. Heater N.K., Warrior S., Lu J. Current and future immunotherapy for breast cancer. J. Hematol. Oncol. 2024;17:131. doi: 10.1186/s13045-024-01649-z. - DOI - PMC - PubMed
    1. Harbeck N., Gnant M. Breast cancer. Lancet. 2017;389:1134–1150. doi: 10.1016/S0140-6736(16)31891-8. - DOI - PubMed
    1. Onkar S.S., Carleton N.M., Lucas P.C., Bruno T.C., Lee A.V., Vignali D.A.A., Oesterreich S. The Great Immune Escape: Understanding the Divergent Immune Response in Breast Cancer Subtypes. Cancer Discov. 2023;13:23–40. doi: 10.1158/2159-8290.CD-22-0475. - DOI - PMC - PubMed
    1. Wang S., Long H., Hou L., Feng B., Ma Z., Wu Y., Zeng Y., Cai J., Zhang D.W., Zhao G. The mitophagy pathway and its implications in human diseases. Signal Transduct. Target. Ther. 2023;8:304. doi: 10.1038/s41392-023-01503-7. - DOI - PMC - PubMed

Substances

LinkOut - more resources