. 2025 Feb 13;26(4):1584.
doi: 10.3390/ijms26041584.

Transcriptome-Wide Insights: Neonatal Lactose Intolerance Promotes Telomere Damage, Senescence, and Cardiomyopathy in Adult Rat Heart

Affiliations

Transcriptome-Wide Insights: Neonatal Lactose Intolerance Promotes Telomere Damage, Senescence, and Cardiomyopathy in Adult Rat Heart

Olga V Anatskaya et al. Int J Mol Sci. .

Abstract

Cardiovascular diseases (CVD) are the primary cause of mortality globally. A significant aspect of CVD involves their association with aging and susceptibility to neonatal programming. These factors suggest that adverse conditions during neonatal development can disrupt cardiomyocyte differentiation, thereby leading to heart dysfunction. This study focuses on the long-term effects of inflammatory and oxidative stress due to neonatal lactose intolerance (NLI) on cardiomyocyte transcriptome and phenotype. Our recent bioinformatic study focused on toggle genes indicated that NLI correlates with the switch off of some genes in thyroid hormone, calcium, and antioxidant signaling pathways, alongside the switch-on/off genes involved in DNA damage response and inflammation. In the presented study, we evaluated cardiomyocyte ploidy in different regions of the left ventricle (LV), complemented by a transcriptomic analysis of genes with quantitative (gradual) difference in expression. Cytophotometric and morphologic analyses of LV cardiomyocytes identified hyperpolyploidy and bridges between nuclei suggesting telomere fusion. Transcriptomic profiling highlighted telomere damage, aging, and chromatin decompaction, along with the suppression of pathways governing muscle contraction and energy metabolism. Echocardiography revealed statistically significant LV dilation and a decrease in ejection fraction. The estimation of survival rates indicated that NLI shortened the median lifespan by approximately 18% (p < 0.0001) compared with the control. Altogether, these findings suggest that NLI may increase susceptibility to cardiovascular diseases by accelerating aging due to oxidative stress and increased telomere DNA damage, leading to hyperpolyploidization and reduced cardiac contractile function. Collectively, our data emphasize the importance of the early identification and management of neonatal inflammatory and metabolic stressors, such as NLI, to mitigate long-term cardiovascular risks.

Keywords: DNA damage; cardiomyocyte; cardiovascular disease; developmental programming; metabolic deprivation; neonatal lactose intolerance; polyploidy; senescence; telomere fusion.


Conflict of interest statement

The authors declare no potential conflicts of interest.

Figures

Figure 1
Figure 1
The Kaplan–Meier curves of survival rates for NLI rats and control rats. NLI-survived rats show reduced lifespan compared with control (p < 0.0001; Mantel-Cox test).
Figure 2
Figure 2
Echocardiography analysis of the hearts from NLI-survived and control rats at the age of 140 days. (A)—left ventricle end diastolic diameter (LVEDd); (B)—left ventricle end systolic diameter (LVEDs); (C)—end diastolic volume (EDV); (D)—end systolic volume (ESV); (E)—fraction shortening (FS); (F)—ejection fraction (EF). Green symbols show control, Blue symbols show the Experiment. ***—p < 0.001.
Figure 3
Figure 3
Distribution of cardiomyocytes by ploidy classes in different regions of the cardiac left ventricle, including the interventricular septum (A), apex (B), and basal part (C). It is evident that polyploid cells are present in all regions of the left ventricle, with increased ploidy primarily resulting from the accumulation of tetraploid and octoploid nuclei. Control and the Experiment are shown in different colors.
Figure 4
Figure 4
Two-dimensional histogram of gene expression levels in the experiment (Lactose) and control (Control). Four density peaks in the gene expression distribution are visible: the bottomleft (no expression in either the experiment or control), topleft (expression only in the experiment), bottomright (expression only in the control), and topright (expression in both the experiment and control—the peak of primary interest). Blue to red color gradient reflects positive gradient in gene density (the lowest density is shown in blue, the highest density is shown in red). A white circle shows genes of interest, i.e., the genes demonstrating quantitative difference between control and the experiment.
Figure 5
Figure 5
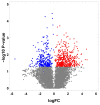
Transcriptome changes in the left ventricle (LV) of the heart in adult rats after NLI (volcano plot). Only genes with quantitative changes in expression are shown, meaning those expressed in both the control and experimental groups. log FC represents the logarithmic values of expression differences between the control and experimental groups. log10 p-value indicates the statistical significance of these differences. Gray dots represent non-significant changes, red dots indicate increased expression (p < 0.05), and blue dots indicate decreased expression (p < 0.05).
Figure 6
Figure 6
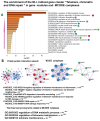
Enrichment of NLI-induced genes related to the “Telomeres, Chromatin, and DNA Repair” cluster in gene pathways, processes, and molecular complexes. (A)—Histogram of gene modules and biological processes. The statistical significance of enrichment is shown on the X-axis (−log10(p)). (B)—Protein–protein interaction network and MCODE components (i.e., densely connected network components). The network and MCODE components were constructed based on physical interactions obtained from the STRING server (physical score > 0.4). The three most significant terms related to the MCODE components are highlighted. The coding by color squares reflects the MCODE components. The coding by color circles indicates the results of the MCODE component pathway and process enrichment analysis. The figure illustrates the association between NLI and long-term telomere DNA and telomere damage, as well as chromatin remodeling.
Figure 7
Figure 7
Isolated cardiomyocytes with joined nuclei as an indicator of telomere fusion (A)—cardiomyocytes with joined nuclei form the heart of an experimental animal. (B) cardiomyocytes with separated nuclei from the control animal. Cells were isolated with enzymatic method, nuclear staining with Hoechst 33258. Combined transmitted light and fluorescence imaging. Phase contrast, total magnification X200. (C) Bar chart illustrating the difference in the percentage of joined nuclei between the experimental and control animals. ***—p < 0.00001, binomial proportion. Blue color– indicates the experiment; Grey color indicates control.
Figure 8
Figure 8
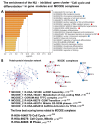
Enrichment of NLI-inhibited genes related to the “Cell Cycle and differentiation” cluster in gene pathways, processes, and molecular complexes. (A)—Histogram of gene modules and biological processes. The statistical significance of enrichment is shown on the X-axis (−log10(p)). (B)—Protein–protein interaction network and MCODE components (i.e., densely connected network components). The network and MCODE components were constructed based on physical interactions obtained from the STRING server (physical score > 0.4). The three most significant terms related to the MCODE components are highlighted. The coding by color squares reflects the MCODE components. The coding by color circles indicates the results of the MCODE component pathway and process enrichment analysis. The figure illustrates the association between NLI and long-term cell cycle restitution and the impairment of cell differentiation.
Figure 9
Figure 9
Enrichment of NLI-induced genes related to “Senescence and cardiomyopathy” cluster in gene pathways, processes, and molecular complexes. (A)—Histogram of gene modules and biological processes. The statistical significance of enrichment is shown on the X-axis (−log10(p)). (B)—Protein–protein interaction network and MCODE components (i.e., densely connected network components). The network and MCODE components were constructed based on physical interactions obtained from the STRING server (physical score > 0.4). The three most significant terms related to the MCODE components are highlighted. The coding by color squares reflects the MCODE components. The coding by color circles indicates the results of the MCODE component pathway and process enrichment analysis. The figure illustrates the association between NLI, premature heart senescence and cardiomyopathy.
Figure 10
Figure 10
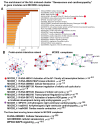
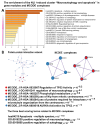
Enrichment of NLI-induced genes related to the “Macroautophagy” cluster in gene pathways, processes, and molecular complexes. (A)—Histogram of gene modules and biological processes. The statistical significance of enrichment is shown on the X-axis (−log10(p)). (B)—Protein–protein interaction network and MCODE components (i.e., densely connected network components). The network and MCODE components were constructed based on physical interactions obtained from the STRING server (physical score > 0.4). The three most significant terms related to the MCODE components are highlighted. The coding by color squares reflects the MCODE components. The coding by color circles indicates the results of MCODE component pathway and process enrichment analysis. The figure illustrates the association between NLI and long-term macroautophagy activation leading to cardiomyocyte atrophy.
Figure 11
Figure 11
Enrichment of NLI-induced genes related to the cluster “Complement cascade, ciliogenesis and blood pressure” in gene pathways, processes, and molecular complexes. (A)—Histogram of gene modules and biological processes. The statistical significance of enrichment is shown on the X-axis (−log10(p)). (B)—Protein–protein interaction network and MCODE components (i.e., densely connected network components). The network and MCODE components were constructed based on physical interactions obtained from the STRING server (physical score > 0.4). The three most significant terms related to the MCODE components are highlighted. The coding by color squares reflects the MCODE components. The coding by color circles indicates the results of MCODE component pathway and process enrichment analysis. The figure illustrates the association between NLI and the long-term activation of pro-inflammatory cascade of complement, enhanced ciliogenesis, and defects of mitotic apparatus.
Figure 12
Figure 12
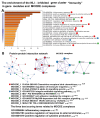
Enrichment of NLI-inhibited genes related to the cluster “Immunity” in gene pathways, processes, and molecular complexes. (A)—Histogram of gene modules and biological processes. The statistical significance of enrichment is shown on the X-axis (−log10(p)). (B)—Protein–protein interaction network and MCODE components (i.e., densely connected network components). The network and MCODE components were constructed based on physical interactions obtained from the STRING server (physical score > 0.4). The three most significant terms related to the MCODE components are highlighted. The coding by color squares reflects the MCODE components. The coding by color circles indicates the results of MCODE component pathway and process enrichment analysis. The figure illustrates the association between NLI and long-term impairment of acquired immunity.
Figure 13
Figure 13
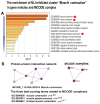
Enrichment of NLI-inhibited genes related to the “Muscle contraction” cluster in gene pathways, processes, and molecular complexes. (A)—Histogram of gene modules and biological processes. The statistical significance of enrichment is shown on the X-axis (−log10(p)). (B)—Protein–protein interaction network and MCODE components (i.e., densely connected network components). The network and MCODE components were constructed based on physical interactions obtained from the STRING server (physical score > 0.4). The three most significant terms related to the MCODE components are highlighted. The coding by color squares reflects the MCODE components. The coding by color circles indicates the results of MCODE component pathway and process enrichment analysis. The Figure illustrates the association between NLI and the long-term impairment of cardiac muscle contraction.
Figure 14
Figure 14
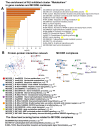
Enrichment of NLI-inhibited genes related to the “Metabolism” cluster in gene pathways, processes, and molecular complexes. (A)—Histogram of gene modules and biological processes. The statistical significance of enrichment is shown on the X-axis (−log10(p)). (B)—Protein–protein interaction network and MCODE components (i.e., densely connected network components). The network and MCODE components were constructed based on physical interactions obtained from the STRING server (physical score > 0.4). The three most significant terms related to the MCODE components are highlighted. The coding by color squares reflects the MCODE components. The coding by color circles indicates the results of the MCODE component pathway and the process-enrichment analysis. The Figure illustrates the association between NLI and the long-term impairment of energy metabolism.

References

    1. Abdellatif M., Rainer P.P., Sedej S., Kroemer G. Hallmarks of Cardiovascular Ageing. Nat. Rev. Cardiol. 2023;20:754–777. doi: 10.1038/s41569-023-00881-3. - DOI - PubMed
    1. Kobelyatskaya A.A., Guvatova Z.G., Tkacheva O.N., Isaev F.I., Kungurtseva A.L., Vitebskaya A.V., Kudryavtseva A.V., Plokhova E.V., Machekhina L.V., Strazhesko I.D., et al. EchoAGE: Echocardiography-Based Neural Network Model Forecasting Heart Biological Age. Aging Dis. 2024;16 doi: 10.14336/AD.2024.0615. Published ahead of print . - DOI - PubMed
    1. He S., Yan L., Yuan C., Li W., Wu T., Chen S., Li N., Wu M., Jiang J. The Role of Cardiomyocyte Senescence in Cardiovascular Diseases: A Molecular Biology Update. Eur. J. Pharmacol. 2024;983:176961. doi: 10.1016/j.ejphar.2024.176961. - DOI - PubMed
    1. Yazdanyar A., Newman A.B. The Burden of Cardiovascular Disease in the Elderly: Morbidity, Mortality, and Costs. Clin. Geriatr. Med. 2009;25:563–577. doi: 10.1016/j.cger.2009.07.007. - DOI - PMC - PubMed
    1. Vakka A., Warren J.S., Drosatos K. Cardiovascular Aging: From Cellular and Molecular Changes to Therapeutic Interventions. J. Cardiovasc. Aging. 2023;3:23. doi: 10.20517/jca.2023.09. - DOI - PMC - PubMed

LinkOut - more resources