. 2025 Feb 14;26(4):1630.
doi: 10.3390/ijms26041630.

Alteration of Serum Gal-3 Levels in Endometrium-Related Reproductive Disorders

Affiliations

Alteration of Serum Gal-3 Levels in Endometrium-Related Reproductive Disorders

Reka Brubel et al. Int J Mol Sci. .

Abstract

Endometriosis, a benign, chronic gynecological disorder characterized by the presence of endometrial-like tissue outside the uterine cavity, affects 15% of women of reproductive age. Galectins, a family of beta-galactoside-binding proteins, regulate inflammation and autoimmunity and are widely expressed in reproductive tissues. This study aimed to assess Galectin-3 (Gal-3) levels in the serum of patients with endometriosis compared to asymptomatic controls and investigate serum Gal-3 level changes over a one-year follow-up period of patients with endometriosis. To determine the levels of soluble Gal-3 in the serum of women with endometriosis or gynecological tumors as well as healthy controls, a human Gal-3-specific ELISA was used. Our findings revealed significantly elevated serum Gal-3 levels in patients with endometriosis compared with healthy controls. Furthermore, Gal-3 concentrations were markedly higher in patients with malignant gynecological transformation of the endometrium than in patients with or without endometriosis. During the one-year follow-up, patients with endometriosis exhibited a progressive increase in serum Gal-3 levels. These findings highlight the potential of Gal-3 as a biomarker for endometriosis and related gynecological conditions. However, further prospective studies with larger, more representative patient cohorts are needed to validate its clinical value.

Keywords: endometriosis; galectin; non-invasive diagnosis.


Conflict of interest statement

The authors declare that they have no known competing financial interests or personal relationships that could have appeared to influence the work reported in this paper.

Figures
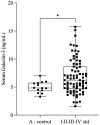
Figure 1
Figure 1
Serum galectin-3 levels in patients with endometriosis (stage I–IV) and healthy controls (A-control). The box plot diagram represents the interquartile range and median values. Whiskers indicate the most extreme observations. The individual values are presented with black dots (A-control group, n = 14) and squares (endometriosis patients, n = 77). The Mann–Whitney U test was used for statistical analysis. * p ≤ 0.05.
Figure 2
Figure 2
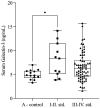
Serum galectin-3 levels in the healthy control group (A-control) and the minimal or mild (I–II) and severe (III–IV) stages of endometriosis. The box plot diagram represents the interquartile range and median values. Whiskers indicate the most extreme observations. The individual values are presented with black dots (A-control, n = 14), squares (minimal or mild endometriosis (I–II stage), n = 11), and triangles (severe endometriosis (III–IV stage) n = 66). The Kruskal–Wallis test with Dunn’s multiple comparisons was used for statistical analysis. * p ≤ 0.05.
Figure 3
Figure 3
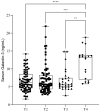
Serum galectin-3 levels during the follow-up of our patients after surgery. The box plot diagram represents the interquartile range and median values. Whiskers indicate the most extreme observations. The individual values are presented with black dots (before surgery (T1), n = 77), squares (after surgery (T2), n = 75), upward triangles (after one month (T3), n = 29), and downward triangles (after one year (T4), n = 18). Mixed-effects analysis with Geisser–Greenhouse correction and Holm–Sídák multiple comparison tests, with individual variances computed for each comparison, were used for statistical analysis. ** p ≤ 0.01, *** p ≤ 0.001, **** p ≤ 0.0001.
Figure 4
Figure 4
(a) Serum galectin-3 levels in patients with minimal or mild endometriosis (stage I–II) during follow-up after surgery. The box plot diagram represents the interquartile range and median values. Whiskers indicate the most extreme observations. The individual values are presented with black dots (before surgery (T1), n = 11), squares (after surgery (T2), n = 11), upward triangles (after one month (T3), n = 4), and downward triangles (after one year (T4), n = 3). Mixed-effects analysis with Geisser–Greenhouse correction and Holm–Sídák multiple comparison tests, with individual variances computed for each comparison, were used for statistical analysis. (b) Serum galectin-3 levels in patients with severe endometriosis (stage III–IV) during follow-up after surgery. The box plot diagram represents the interquartile range and median values. Whiskers indicate the most extreme observations. The individual values are presented with black dots (before surgery (T1), n = 66), squares (after surgery (T2), n = 64), upward triangles (after one month (T3), n = 25), and downward triangles (after one year (T4), n = 15). Mixed-effects analysis with Geisser–Greenhouse correction and Holm–Sídák multiple comparison tests, with individual variances computed for each comparison, were used for statistical analysis. ** p ≤ 0.01, *** p ≤ 0.001.
Figure 5
Figure 5
Serum galectin-3 levels in the control group (A-control), patients with endometriosis patients (stages IIV. stages), patients with endometrium-related malignant tumors (O-control), and patients with benign gynecological disease (G-patients). The box plot diagram represents the interquartile range and median values. Whiskers indicate the most extreme observations. The individual values are presented with black dots (A-control group, n = 14), squares (endometriosis group, n = 77), upward triangles (O-control, n = 22), and downward triangles (G-patients, n = 11). Kruskal–Wallis test with Dunn’s multiple comparison analysis was used for statistical analysis. * p ≤ 0.05.
Figure 6
Figure 6
The receiver operating characteristic curve analysis of the serum Galectin-3 levels in patients with endometriosis and healthy controls.
Figure 7
Figure 7
Flowchart of study population.

References

    1. Zondervan K.T., Becker C.M., Missmer S.A. Endometriosis. N. Engl. J. Med. 2020;382:1244–1256. doi: 10.1056/NEJMra1810764. - DOI - PubMed
    1. Canis M., Donnez J.G., Guzick D.S., Halme J.K., Rock J.A., Schenken R.S., Vernon M.W. Revised American Society for Reproductive Medicine classification of endometriosis: 1996. Fertil. Steril. 1997;67:817–821. - PubMed
    1. Rocha A.L., Reis F.M., Petraglia F. New trends for the medical treatment of endometriosis. Expert Opin. Investig. Drugs. 2012;7:905–919. doi: 10.1517/13543784.2012.683783. - DOI - PubMed
    1. Noël J.C., Chapron C., Borghese B., Fayt I., Anaf V. Galectin-3 is overexpressed in various forms of endometriosis. Appl. Immunohistochem. Mol. Morphol. 2011;3:253–257. doi: 10.1097/PAI.0b013e3181f5a05e. - DOI - PubMed
    1. Vergetaki A., Jeschke U., Vrekoussis T., Taliouri E., Sabatini L., Papakonstanti E.A., Makrigiannakis A. Galectin-1 overexpression in endometriosis and its regulation by neuropeptides (CRH, UCN) indicating its important role in reproduction and inflammation. PLoS ONE. 2014;9:12. doi: 10.1371/journal.pone.0114229. - DOI - PMC - PubMed

LinkOut - more resources