. 2025 Feb 14;26(4):1648.
doi: 10.3390/ijms26041648.

Comprehensive Bioinformatics Analysis of Glycosylation-Related Genes and Potential Therapeutic Targets in Colorectal Cancer

Affiliations

Comprehensive Bioinformatics Analysis of Glycosylation-Related Genes and Potential Therapeutic Targets in Colorectal Cancer

Po-Kai Chuang et al. Int J Mol Sci. .

Abstract

Colorectal cancer (CRC) is a leading cause of cancer-related deaths worldwide, characterized by high incidence and poor survival rates. Glycosylation, a fundamental post-translational modification, influences protein stability, signaling, and tumor progression, with aberrations implicated in immune evasion and metastasis. This study investigates the role of glycosylation-related genes (Glycosylation-RGs) in CRC using machine learning and bioinformatics. Data from The Cancer Genome Atlas (TCGA) and the Molecular Signatures Database (MSigDB) were analyzed to identify 67 differentially expressed Glycosylation-RGs. These genes were used to classify CRC patients into two subgroups with distinct survival outcomes, highlighting their prognostic value. Weighted gene coexpression network analysis (WGCNA) revealed key modules associated with CRC traits, including pathways like glycan biosynthesis and PI3K-Akt signaling. A machine-learning-based prognostic model demonstrated strong predictive performance, stratifying patients into high- and low-risk groups with significant survival differences. Additionally, the model revealed correlations between risk scores and immune cell infiltration, providing insights into the tumor immune microenvironment. Drug sensitivity analysis identified potential therapeutic agents, including Trametinib, SCH772984, and Oxaliplatin, showing differential efficacy between risk groups. These findings enhance our understanding of glycosylation in CRC, identifying it as a critical factor in disease progression and a promising target for future therapeutic strategies.

Keywords: bioinformatics; colorectal cancer; drug sensitivity analysis; glycosylation; immune microenvironment; machine learning; prognostic model.


Conflict of interest statement

The authors declare no conflict of interest.

Figures

Figure 1
Figure 1
Identification of differentially expressed glycosylation-related genes in CRC. (A) Volcano plot displaying the distribution of differentially expressed genes in the TCGA-COAD dataset. Blue dots indicate downregulated genes, red dots indicate upregulated genes, and black dots represent non-significant genes. The x-axis shows log2 (fold change), while the y-axis shows −log10 (FDR). (B) Venn diagram illustrating the overlap between glycosylation-related genes and differentially expressed genes in TCGA-COAD. The intersection identifies 67 overlapping genes critical for further analysis.
Figure 2
Figure 2
Identification of glycosylation-related subgroups in CRC. (A) Consensus matrix heatmap demonstrating optimal clustering into two subgroups (C1 and C2) using glycosylation-related genes. (B) Principal component analysis (PCA) showing the separation between subgroups C1 and C2. (C) Kaplan–Meier survival curves illustrating overall survival differences between the subgroups, with subgroup C1 showing poorer survival outcomes (p = 0.043). The x-axis represents time in months. (D) Heatmap displaying glycosylation-related gene expression in subgroups C1 and C2, alongside clinicopathological characteristics. (E) Heatmap depicting immune cell infiltration patterns in the two subgroups. (F) Boxplots showing significant differences in the abundance of specific immune cell types between subgroups C1 and C2 (e.g., macrophages M0, macrophages M1, and macrophages M2, ns: not significant, * p < 0.05, ** p < 0.01, and *** p < 0.001).
Figure 3
Figure 3
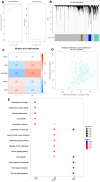
Identification of highly correlated gene modules using weighted gene coexpression network analysis (WGCNA). (A) Soft thresholding power determination for constructing a scale-free network, showing the scale-free topology fit index and mean connectivity for different power values. (B) Cluster dendrogram of glycosylation-related genes grouped into distinct modules, with colors representing module membership. (C) Module–trait relationships illustrating correlations between modules (e.g., turquoise, blue, brown) and clinical traits, such as tumor presence. (D) Scatter plot showing the correlation between module membership and gene significance in the turquoise module, which is highly associated with CRC. (E) KEGG pathway enrichment analysis for genes in the turquoise module, highlighting pathways such as “focal adhesion,” “PI3K–Akt signaling,” and “ECM–receptor interaction.
Figure 4
Figure 4
Identification of glycosylation-related gene clusters in CRC. (A) Consensus matrix heatmap defining four gene clusters (C1, C2, C3, and C4) based on glycosylation-related gene expression. (B) Principal component analysis (PCA) visualizing the separation of samples into four clusters. (C) Kaplan–Meier survival curves showing significant differences in overall survival among the four clusters (p = 0.0018), with cluster C1 demonstrating the poorest survival. (D) Heatmap depicting the expression patterns of glycosylation-related genes across the four clusters, alongside associated clinicopathological characteristics.
Figure 5
Figure 5
Construction of a glycosylation-related prognostic risk model for CRC. (A) Coefficient profiles of selected genes during LASSO regression. Different-colored lines represent individual genes. (B) Partial likelihood deviance plot to determine the optimal lambda value for the model, with the minimum value marked by a dotted line. (C) Kaplan–Meier survival curves showing a significant difference in overall survival between high-risk (red) and low-risk (blue) groups in the training dataset (p = 0.00013). (D) Distribution of risk scores, survival status, and gene expression profiles in the high- and low-risk groups. The top panel shows risk scores, the middle panel displays survival outcomes (green dots: alive; orange triangles: deceased), and the bottom heatmap illustrates the expression patterns of selected prognostic genes.
Figure 6
Figure 6
Validation of the glycosylation-related prognostic risk model for CRC. (A) Time-dependent ROC curves for predicting overall survival at 1, 3, and 5 years, showing AUC values of 0.7, 0.7, and 0.74, respectively. (B) Boxplots comparing the expression levels of the key prognostic genes (TUB and MPP2) between high- and low-risk groups, indicating significant differences (*** p < 0.001). (C) Kaplan–Meier survival curves for individual genes TUB (left) and MPP2 (right), with high expression associated with poorer overall survival (p = 0.019 and p = 0.00094, respectively).
Figure 7
Figure 7
Correlation between immune cell infiltration and glycosylation-related risk scores in CRC. (AJ) Scatter plots showing significant correlations between the glycosylation-related risk score and the infiltration levels of various immune cell types, including activated (A) dendritic cells, (B) resting dendritic cells, (C) macrophages M0, (D) macrophages M1, (E) macrophages M2, (F) regulatory T cells, (G) resting memory CD4+ T cells, (H) monocytes, (I) neutrophils, and (J) resting mast cells. Each purple line indicates the linear regression trend, with shaded areas representing the 95% confidence interval. (K) Heatmap illustrating the relationship between the expression of key prognostic genes (TUB and MPP2) and immune cell infiltration. Red indicates positive correlation, and blue indicates negative correlation (* p < 0.05, ** p < 0.01, and *** p < 0.001).
Figure 8
Figure 8
Drug sensitivity analysis (IC50) of high- and low-risk groups predicted by oncoPredict. Boxplots display the top five drugs with the largest differences in predicted sensitivity between high-risk (red) and low-risk (green) groups and the top five drugs with the smallest differences. (A) Trametinib, (B) SCH772984, (C) oxaliplatin, (D) Acetalax, and (E) VX-11e are the top five drugs with significantly higher sensitivity in the low-risk group. Conversely, (F) AZD8055, (G) doxorubicin, (H) axitinib, (I) NU7441, and (J) ZM447439 showed lower differences in sensitivity between the groups.

References

    1. Xi Y., Xu P. Global colorectal cancer burden in 2020 and projections to 2040. Transl. Oncol. 2021;14:101174. doi: 10.1016/j.tranon.2021.101174. - DOI - PMC - PubMed
    1. Arnold M., Sierra M.S., Laversanne M., Soerjomataram I., Jemal A., Bray F. Global patterns and trends in colorectal cancer incidence and mortality. Gut. 2017;66:683–691. doi: 10.1136/gutjnl-2015-310912. - DOI - PubMed
    1. Hossain M.S., Karuniawati H., Jairoun A.A., Urbi Z., Ooi D.J., John A., Lim Y.C., Kibria K.K., Mohiuddin A., Ming L.C. Colorectal cancer: A review of carcinogenesis, global epidemiology, current challenges, risk factors, preventive and treatment strategies. Cancers. 2022;14:1732. doi: 10.3390/cancers14071732. - DOI - PMC - PubMed
    1. Andrei P., Battuello P., Grasso G., Rovera E., Tesio N., Bardelli A. Integrated approaches for precision oncology in colorectal cancer: The more you know, the better. Semin. Cancer Biol. 2022;84:199–213. doi: 10.1016/j.semcancer.2021.04.007. - DOI - PubMed
    1. Beniwal S.S., Lamo P., Kaushik A., Lorenzo-Villegas D.L., Liu Y., MohanaSundaram A. Current status and emerging trends in colorectal cancer screening and diagnostics. Biosensors. 2023;13:926. doi: 10.3390/bios13100926. - DOI - PMC - PubMed

Substances

LinkOut - more resources