

Integrative Analysis of Transcriptomics and Proteomics for Screening Genes and Regulatory Networks Associated with Lambda-Cyhalothrin Resistance in the Plant Bug Lygus pratensis Linnaeus (Hemiptera: Miridae)
- PMID: 40004208
- PMCID: PMC11855015
- DOI: 10.3390/ijms26041745
Integrative Analysis of Transcriptomics and Proteomics for Screening Genes and Regulatory Networks Associated with Lambda-Cyhalothrin Resistance in the Plant Bug Lygus pratensis Linnaeus (Hemiptera: Miridae)
Abstract
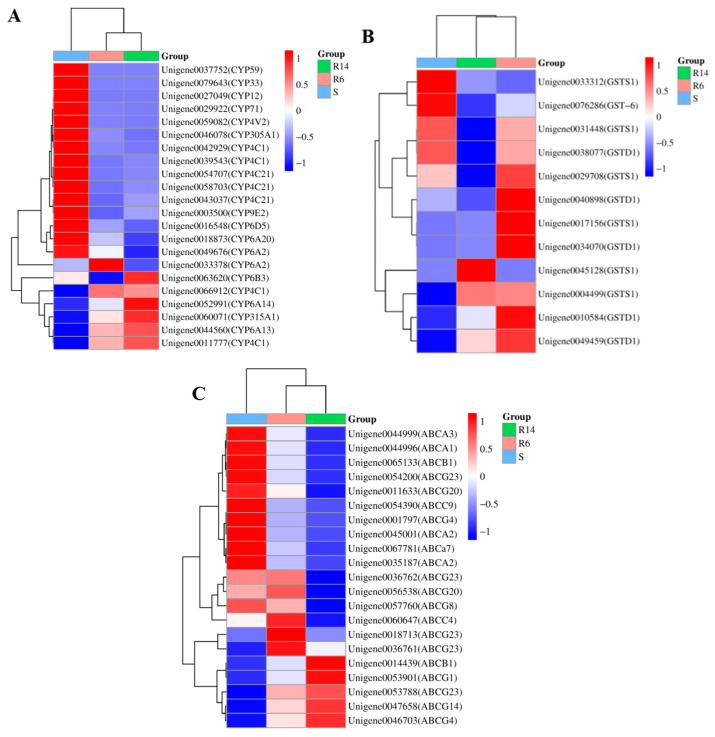
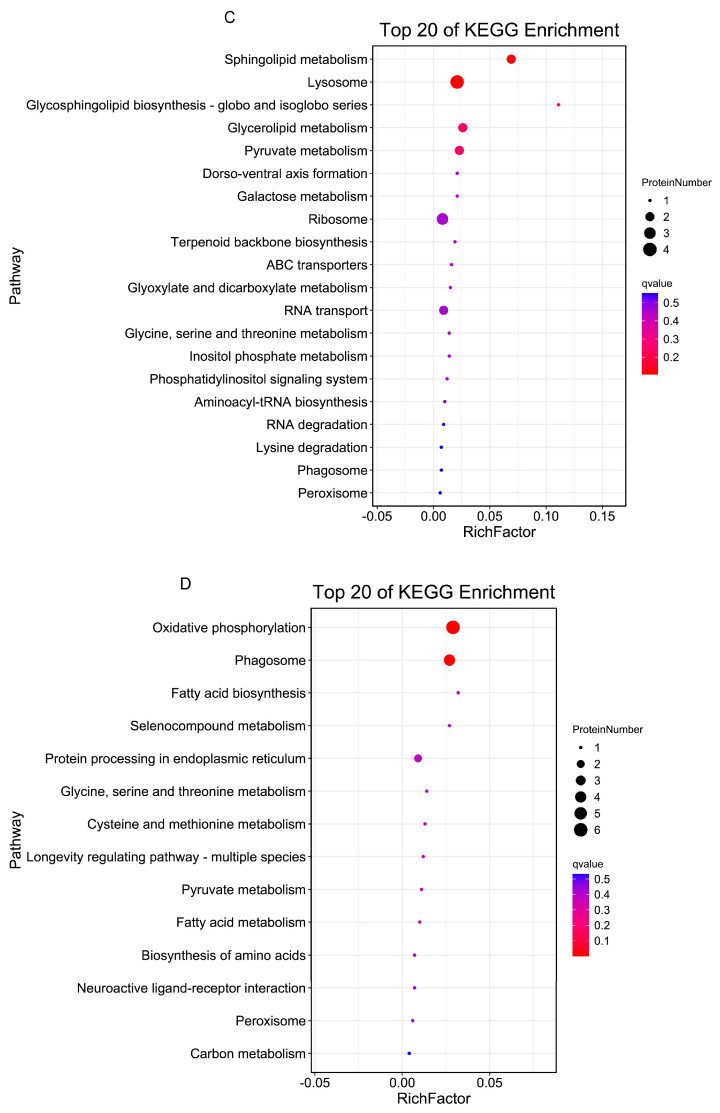
The prolonged use of pyrethroid insecticides for controlling the plant bug Lygus pratensis has led to upward resistance. This study aims to elucidate the molecular mechanisms and potential regulatory pathways associated with lambda-cyhalothrin resistance in L. pratensis. In this study, we constructed a regulatory network by integrating transcriptome RNA-Seq and proteome iTRAQ sequencing analyses of one lambda-cyhalothrin-susceptible strain and two resistant strains, annotating key gene families associated with detoxification, identifying differentially expressed genes and proteins, screening for transcription factors involved in the regulation of detoxification metabolism, and examining the metabolic pathways involved in resistance. A total of 82,919 unigenes were generated following the assembly of transcriptome data. Of these, 24,859 unigenes received functional annotations, while 1064 differential proteins were functionally annotated, and 1499 transcription factors belonging to 64 distinct transcription factor families were identified. Notably, 66 transcription factors associated with the regulation of detoxification metabolism were classified within the zf-C2H2, Homeobox, THAP, MYB, bHLH, HTH, HMG, and bZIP families. Co-analysis revealed that the CYP6A13 gene was significantly up-regulated at both transcriptional and translational levels. The GO and KEGG enrichment analyses revealed that the co-up-regulated DEGs and DEPs were significantly enriched in pathways related to sphingolipid metabolism, Terpenoid backbone biosynthesis, ABC transporters, RNA transport, and peroxisome function, as well as other signaling pathways involved in detoxification metabolism. Conversely, the co-down-regulated DEGs and DEPs were primarily enriched in pathways associated with Oxidative phosphorylation, Fatty acid biosynthesis, Neuroactive ligand-receptor interactions, and other pathways pertinent to growth and development. The results revealed a series of physiological and biochemical adaptations exhibited by L. pratensis during the detoxification metabolism related to lambda-cyhalothrin resistance. This work provided a theoretical basis for further analysis of the molecular regulation mechanism underlying this resistance.
Keywords: Lygus pratensis; detoxification; lambda-cyhalothrin; proteome; resistance; transcriptome.
Conflict of interest statement
The authors declare no conflicts of interest.
Figures


Similar articles
-
Laboratory Selection, Cross-Resistance, Risk Assessment to Lambda-Cyhalothrin Resistance, and Monitoring of Insecticide Resistance for Plant Bug Lygus pratensis (Hemiptera: Miridae) in Farming-Pastoral Ecotones of Northern China.J Econ Entomol. 2021 Apr 13;114(2):891-902. doi: 10.1093/jee/toaa305. J Econ Entomol. 2021. PMID: 33503252
-
Molecular Detection of kdr and superkdr Mutation Sites and Analysis of the Binding Modes of Pyrethroid Insecticides with Voltage-Gated Sodium Channels in the Plant Bug Lygus pratensis (Hemiptera: Miridae).J Agric Food Chem. 2024 Dec 11;72(49):27451-27465. doi: 10.1021/acs.jafc.4c03416. Epub 2024 Sep 3. J Agric Food Chem. 2024. PMID: 39225681
-
Comparative toxicity mechanisms of sulfoxaflor and lambda-cyhalothrin against Apolygus lucorum from enzymatic and transcriptomic perspectives: Efficient application of insecticides.Pestic Biochem Physiol. 2025 Mar;208:106306. doi: 10.1016/j.pestbp.2025.106306. Epub 2025 Jan 24. Pestic Biochem Physiol. 2025. PMID: 40015898
-
Transcriptomic investigation of the molecular mechanisms underlying resistance to the neonicotinoid thiamethoxam and the pyrethroid lambda-cyhalothrin in Euschistus heros (Hemiptera: Pentatomidae).Pest Manag Sci. 2023 Dec;79(12):5349-5361. doi: 10.1002/ps.7745. Epub 2023 Sep 12. Pest Manag Sci. 2023. PMID: 37624650
-
Biology and Ecology of Lygus pratensis (Linn, 1758) (Heteroptera: Miridae): Towards the Practical Management of Cropping Landscapes in China.Insects. 2025 Apr 23;16(5):441. doi: 10.3390/insects16050441. Insects. 2025. PMID: 40429154 Free PMC article. Review.
References
-
- Wu K.M., Li W., Feng H., Guo Y. Seasonal abundance of the mirids, Lygus lucorum and Adelphocoris spp. (hemiptera: Miridae) on Bt cotton in northern China. Crop Prot. 2002;21:997–1002. doi: 10.1016/S0261-2194(02)00080-7. - DOI
-
- Lu Y.H. Ever-evolving advances in the researches of cotton insect pest management in China. J. Plant Prot. 2021;48:937–939.
-
- Lu Y.H., Liang G.M., Wu K.M. Advances in integrated management of Cotton mirids. J. Plant Prot. 2007;33:10–15.
-
- Lu Y.H., Zeng J., Jang Y.Y., Wu K.M. Techniques for surveying Mirid bug (Heteroptera: Miridae) populations and assessing crop damage caused by these pests. Acta Entomol. Sin. 2014;51:848–852.
MeSH terms
Substances
Grants and funding
LinkOut - more resources
Full Text Sources
Research Materials
