. 2025 Feb 19;26(4):1766.
doi: 10.3390/ijms26041766.

Application of an Integrated Single-Cell and Three-Dimensional Spheroid Culture Platform for Investigating Drug Resistance Heterogeneity and Epithelial-Mesenchymal Transition (EMT) in Lung Cancer Subclones

Affiliations

Application of an Integrated Single-Cell and Three-Dimensional Spheroid Culture Platform for Investigating Drug Resistance Heterogeneity and Epithelial-Mesenchymal Transition (EMT) in Lung Cancer Subclones

Shin-Hu Chen et al. Int J Mol Sci. .

Abstract

Lung cancer is a leading cause of cancer-related mortality worldwide, largely due to its heterogeneity and intrinsic drug resistance. Malignant pleural effusions (MPEs) provide diverse tumor cell populations ideal for studying these complexities. Although chemotherapy and targeted therapies can be initially effective, subpopulations of cancer cells with phenotypic plasticity often survive treatment, eventually developing resistance. Here, we integrated single-cell isolation and three-dimensional (3D) spheroid culture to dissect subclonal heterogeneity and drug responses, aiming to inform precision medicine approaches. Using A549 lung cancer cells, we established a cisplatin-resistant line and isolated three resistant subclones (Holoclone, Meroclone, Paraclone) via single-cell sorting. In 3D spheroids, Docetaxel and Alimta displayed higher IC50 values than in 2D cultures, suggesting that 3D models better reflect clinical dosing. Additionally, MPE-derived Holoclone and Paraclone subclones exhibited distinct sensitivities to Giotrif and Capmatinib, revealing their heterogeneous drug responses. Molecular analyses confirmed elevated ABCB1, ABCG2, cancer stem cell (CSC) markers (OCT4, SOX2, CD44, CD133), and epithelial-mesenchymal transition (EMT) markers (E-cadherin downregulation, increased Vimentin, N-cadherin, Twist) in resistant subclones, correlating with enhanced migration and invasion. This integrated approach clarifies the interplay between heterogeneity, CSC/EMT phenotypes, and drug resistance, providing a valuable tool for predicting therapeutic responses and guiding personalized, combination-based lung cancer treatments.

Keywords: cancer stem cells; drug resistance; epithelial–mesenchymal transition; lung cancer; single-cell culture; targeted therapy; three-dimensional spheroid culture.


Conflict of interest statement

The authors declare no conflicts of interest.

Figures
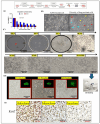
Figure 1
Figure 1
Establishment of Phenotypically Heterogeneous Monoclonal Cell Lines via Single-Cell Cultivation. (A) A549 lung cancer cells were treated with three consecutive doses of cisplatin at the IC50 concentration to simulate clinical chemotherapy pressure and induce drug resistance. The results are means ± SD for each group of cells from three separate experiments. (B) Following treatment, the cell population could be stratified into three phenotypically distinct subclones: tiny irregular shapes (blue arrow), polygonal shape (red arrow), and spindle (yellow arrow), reflecting pronounced intratumoral heterogeneity. (C) Single-cell isolation was performed using a specialized microfluidic cultivation chip. After 10–14 days, individual cell colonies reached approximately 70–80% confluence and were subsequently expanded to about 1 × 10⁷ cells. A portion of the cells was cryopreserved in liquid nitrogen for long-term storage and future analyses. (D) holoclones form tightly packed colonies, indicating their strong self-renewal ability; meroclones form moderately packed colonies; and paraclones form loosely packed colonies. (E) Ki-67 immunostaining further confirms these differences in proliferative capacity: holoclones exhibit high Ki-67 expression, meroclones display moderate levels, and paraclones show low Ki-67 expression.
Figure 2
Figure 2
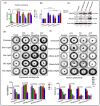
Differential ABCB1/ABCG2 Expression and Chemosensitivity Among Drug-Resistant Subclones. (A) Cisplatin sensitivity in Holoclone, Meroclone, and Paraclone clones versus parental A549 cells. (B,C) Holoclone and Paraclone cells show significantly higher ABCB1/ABCG2 mRNA and protein levels compared to Meroclone and Control cells, indicating enhanced multidrug resistance. (D) In 3D spheroids, Control cells reach Docetaxel IC50 at 5–10 µM, and Meroclone achieves IC50 at 10 µM. By contrast, Holoclone and Paraclone remain insensitive within this concentration range, demonstrating greater Docetaxel tolerance. (E) Under Alimta (5–10 µM), all subclones achieve IC50, maintaining strong inhibitory effects. The results are means ± SD for each group of cells from three separate experiments.
Figure 3
Figure 3
Phenotypic Heterogeneity and Tumorsphere-Based Drug Response Evidence in Primary MPE Cultures. (A) Hematoxylin–eosin (HE) and Papanicolaou’s staining of primary cultures revealed both clustered (yellow arrow) and individually (red arrow) dispersed cell morphologies. In primary cultures, cells displayed both elongated and floating spherical phenotypes. By applying single-cell isolation and expansion techniques, we successfully established two distinct subclones—Holoclone and Paraclone—thereby underscoring their remarkable phenotypic plasticity. (B) In the 3D culture system, MPE primary cells formed stable spheroids within 96 h. Drug sensitivity assays using the 3D tumorsphere model showed that Giotrif (afatinib) at 60 nM and Capmatinib at 6.5 nM achieved IC50. (C) Between the two subclones, the holoclone demonstrated marked sensitivity to Giotrif, whereas the paraclone exhibited only a limited response. In contrast, Capmatinib inhibited Holoclone and Paraclone growth, demonstrating its pronounced inhibitory efficacy against both subclone types. The results are means ± SD for each group of cells from three separate experiments.
Figure 4
Figure 4
Differential Stem Cell-Related Gene and Marker Expression in Drug-Resistant Subclones. (A) After 10 days, Holoclone and Paraclone formed significantly larger spheroids than Control and Meroclone, indicating enhanced self-renewal and proliferation. Meroclone’s spiky morphology suggested an intermediate state. (B) RT-qPCR analyses revealed elevated OCT4 and SOX2 expressions in Holoclone and Paraclone, suggesting enhanced stem-like characteristics. (C) Western blot analyses demonstrated increased OCT4 and SOX2 protein levels in Holoclone and Paraclone, further indicating stronger stem-like traits. (D) Flow cytometry analysis of CD44 and CD133 expression. Representative histograms or dot plots illustrate that more than 50% of cells in the Holoclone, Meroclone, and Paraclone subpopulations are positive for CD44 and CD133, in contrast to fewer than 40% positivity in the Control group. The experiments were performed in at least three independent replicates to ensure reproducibility and statistical robustness. (E) RT-qPCR validation of CSC marker upregulation. Quantification of relative CD44 and CD133 mRNA levels in Holoclone, Meroclone, and Paraclone subclones compared with the Control group, confirming the elevated expression of these CSC-associated genes in all three drug-resistant populations. The results are means ± SD for each group of cells from three separate experiments.
Figure 5
Figure 5
Molecular Characterization of EMT-Driven Invasiveness in Drug-Resistant Subclones. (A,B) Western blot and immunohistochemical analyses of Holoclone and Paraclone subclones reveal significantly higher Vimentin and N-cadherin expression levels compared to Control and Meroclone. Moreover, all three subclones (Holoclone, Meroclone, and Paraclone) exhibit increased Vimentin and N-cadherin, accompanied by reduced E-cadherin expression. (C) Migration assays indicate that these subclones are more migratory than Control. (D) Invasion assays confirm that Holoclone and Paraclone possess greater invasive potential, reflecting an EMT-driven transition. These results suggest that drug-resistant subclones adopt mesenchymal traits and Twist upregulation, enabling them to evade therapeutic pressures, enhance resistance, and potentially contribute to tumor progression, facilitating their survival and dissemination. The results are means ± SD for each group of cells from three separate experiments.

References

    1. Bray F., Ferlay J., Soerjomataram I., Siegel R.L., Torre L.A., Jemal A. Global cancer statistics 2018: GLOBOCAN estimates of incidence and mortality worldwide for 36 cancers in 185 countries. CA Cancer J. Clin. 2018;68:394–424. doi: 10.3322/caac.21492. - DOI - PubMed
    1. Liu Y., Zheng Z. Understanding the global cancer statistics 2022: Growing cancer burden. Sci. China Life Sci. 2024;67:2274–2276. doi: 10.1007/s11427-024-2657-y. - DOI - PubMed
    1. Li Q., Xia C., Li H., Yan X., Yang F., Cao M., Zhang S., Teng Y., He S., Cao M., et al. Disparities in 36 cancers across 185 countries: Secondary analysis of global cancer statistics. Front. Med. 2024;18:911–920. doi: 10.1007/s11684-024-1058-6. - DOI - PubMed
    1. Lim Z.F., Ma P.C. Emerging insights of tumor heterogeneity and drug resistance mechanisms in lung cancer targeted therapy. J. Hematol. Oncol. 2019;12:134. doi: 10.1186/s13045-019-0818-2. - DOI - PMC - PubMed
    1. Bhat G.R., Sethi I., Sadida H.Q., Rah B., Mir R., Algehainy N., Albalawi I.A., Masoodi T., Subbaraj G.K., Jamal F., et al. Cancer cell plasticity: From cellular, molecular, and genetic mechanisms to tumor heterogeneity and drug resistance. Cancer Metastasis Rev. 2024;43:197–228. doi: 10.1007/s10555-024-10172-z. - DOI - PMC - PubMed

MeSH terms