. 2025 Jan 28;16(2):169.
doi: 10.3390/genes16020169.

Analysis of Short Tandem Repeat Expansions in a Cohort of 12,496 Exomes from Patients with Neurological Diseases Reveals Variable Genotyping Rate Dependent on Exome Capture Kits

Affiliations

Analysis of Short Tandem Repeat Expansions in a Cohort of 12,496 Exomes from Patients with Neurological Diseases Reveals Variable Genotyping Rate Dependent on Exome Capture Kits

Clarissa Rocca et al. Genes (Basel). .

Abstract

Background/objectives: Short tandem repeat expansions are the most common cause of inherited neurological diseases. These disorders are clinically and genetically heterogeneous, such as in myotonic dystrophy and spinocerebellar ataxia, and they are caused by different repeat motifs in different genomic locations. Major advances in bioinformatic tools used to detect repeat expansions from short read sequencing data in the last few years have led to the implementation of these workflows into next generation sequencing pipelines in healthcare. Here, we aimed to evaluate the clinical utility of analysing repeat expansions through exome sequencing in a large cohort of genetically undiagnosed patients with neurological disorders.

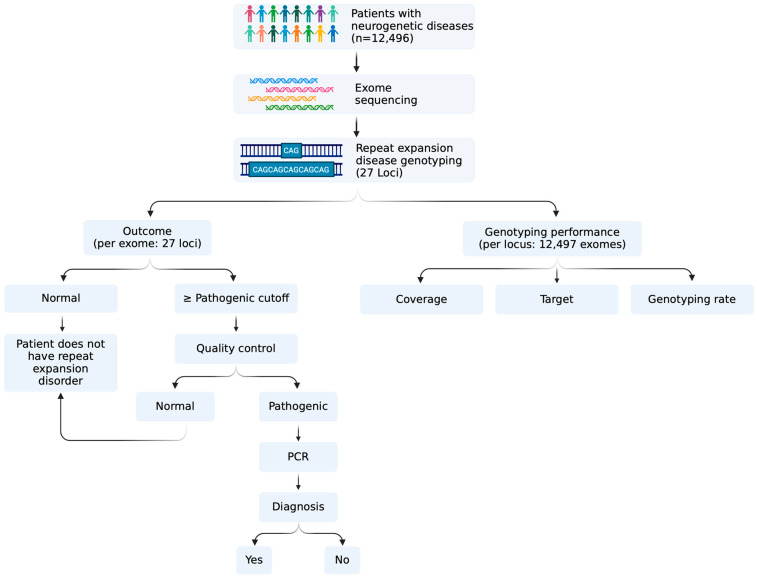
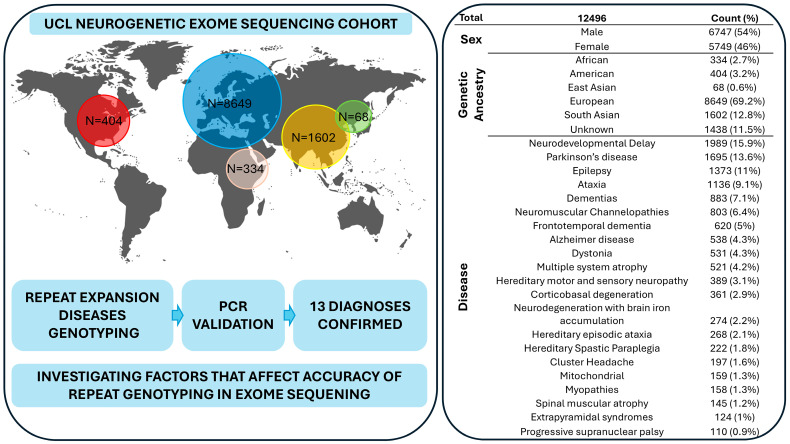
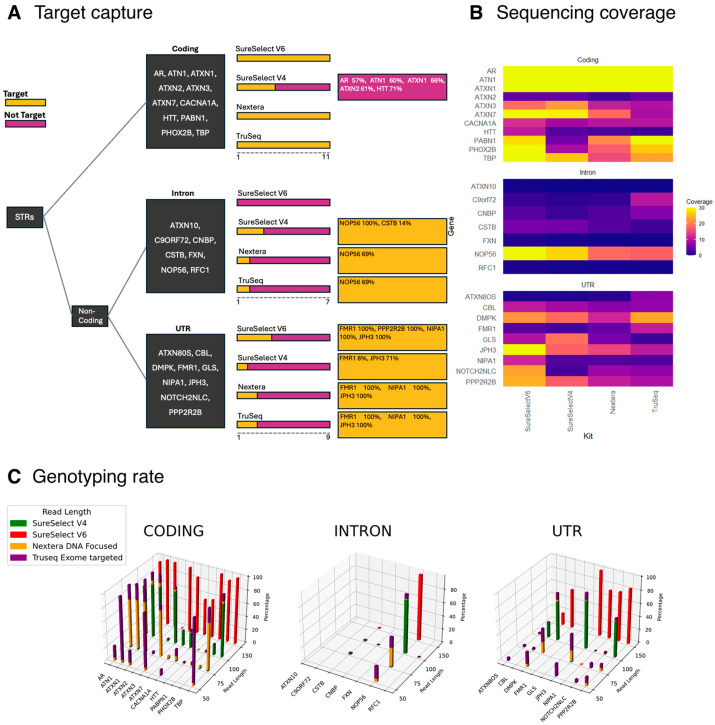
Methods: We here analyse 27 disease-causing DNA repeats found in the coding, intronic and untranslated regions in 12,496 exomes in patients with a range of neurogenetic conditions.

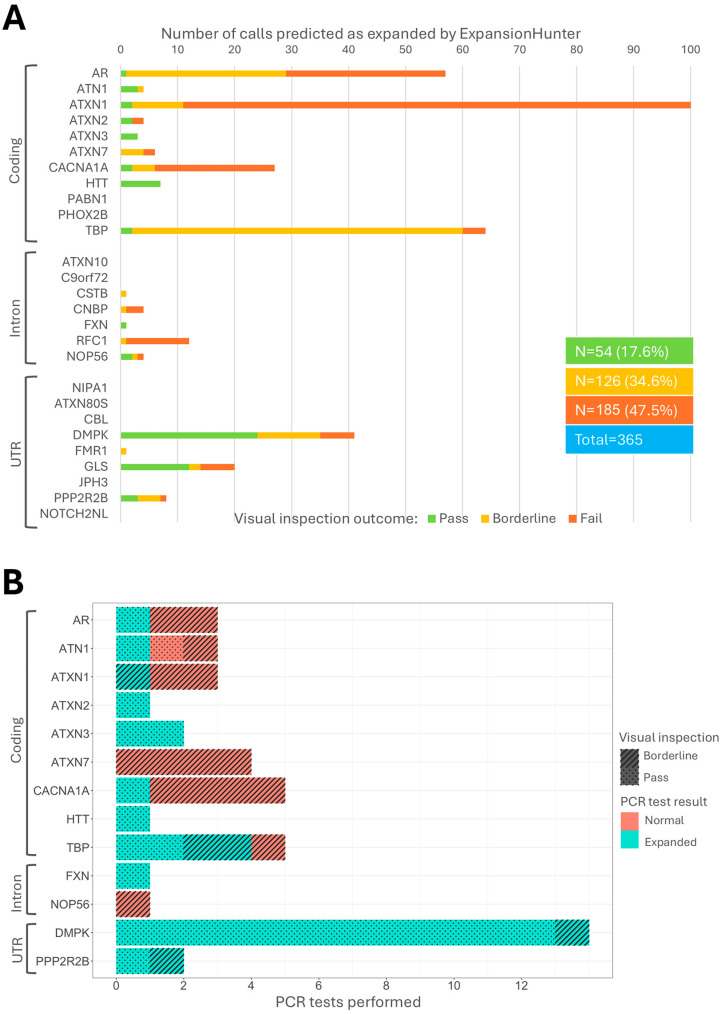
Results: We identified-and validated by polymerase chain reaction-29 repeat expansions across a range of loci, 48% (n = 14) of which were diagnostic. We then analysed the genotyping performance across all repeat loci and found that, despite high coverage in most repeats in coding regions, some loci had low genotyping rates, such as those that cause spinocerebellar ataxia 2 (ATXN2, 0.1-8.4%) and Huntington disease (HTT, 0.2-58.2%), depending on the capture kit. Conversely, while most intronic repeats were not genotyped, we found a high genotyping rate in the intronic locus that causes spinocerebellar ataxia 36 (NOP56, 30.1-98.3%) and in the one that causes myotonic dystrophy type 1 (DMPK, myotonic dystrophy type 1).

Conclusions: We show that the key factors that influence the genotyping rate of repeat expansion loci analysis are the sequencing read length and exome capture kit. These results provide important information about the performance of exome sequencing as a genetic test for repeat expansion disorders.

Keywords: ExpansionHunter; Huntington disease; exome sequencing; myotonic dystrophy; repeat expansion disease; repeat expansion diseases; short read sequencing; short tandem repeat; spinocerebellar ataxia.


Conflict of interest statement

The authors declare no conflicts of interest.

Figures

Figure 1
Figure 1
Schematic overview of the study workflow.
Figure 2
Figure 2
Cohort overview and study design. The map illustrates the global distribution of 12,496 cases included in the cohort, with participant numbers represented by coloured circles: Europe (N = 8649, blue), East Asia (N = 1602, yellow), Africa (N = 404, red), America (N = 334, dark red), and South Asia (N = 68, green). The right panel provides the demographic information and diagnostic categories included in the analysis. The study design is summarised in the blue boxes at the bottom.
Figure 3
Figure 3
Total number of repeat expansions identified by EH, visual inspection and PCR validation. (A) 365 repeat expansions identified by EH with the visual inspection outcome. Loci are divided into three groups: coding, intron and UTR. Green bars represent calls that passed visual inspection, yellow bars are for calls that were categorised in the “borderline” group and red bars indicate samples that failed visual inspection. Loci that do not have a bar next to them did not have any expanded calls predicted by EH. (B) The outcome of PCR-tested samples. The light blue bars indicate samples that tested positive for PCR, while the pink bars represent samples that tested negative. Stripes indicate cases that were in the visual inspection “Pass” category, whereas dots represent cases that were “borderline” after visual inspection.
Figure 4
Figure 4
Pedigree of SCA3 family and MRI scan of proband. The red arrow shows the proband. (A) Square = male; circle = female; black filled symbol = affected individual; white symbols = unaffected individuals; diagonal line = deceased individual. Double lines indicate consanguinity. (B) MRI scan of patient IV.8. The red arrow indicates cerebellar atrophy.
Figure 5
Figure 5
Targeted loci and coverage according to the four most used exome sequencing kits in this cohort. (A) The RED loci are categorised based on their genomic location: coding, intron and UTR. Target (purple): the specific region of the gene is targeted by the exome kit. Not target (yellow): the region of interest is not covered by the exome kit. The percentage indicates how much of the region is not covered. For example, in ATN1, 60% of the region of interest is not covered by the SureSelect V4 kit. When not specified, the percentage of target or not target is 0%. The exome sequencing kits are represented by different bars: SureSelect V6, SureSelect V4, Nextera and TruSeq. The dashed lines under each group indicate the total number of RED loci analysed in each category: 12 coding, 7 intronic and 8 UTRs. (B) Heatmap showing the coverage of the analysed RED loci across different genomic regions. Coverage is represented by the number of sequencing reads mapping to each locus, as indicated by the colour scale. (C) 3D plots of the genotyping rate for EH-generated calls by read length and sequencing kit. The three plots show EH calls in coding, intron and UTR loci. In each plot, calls are divided by locus and read length. The four different colours represent the different exome capture kits used.

Similar articles

References

    1. Marwaha S., Knowles J.W., Ashley E.A. A guide for the diagnosis of rare and undiagnosed disease: Beyond the exome. Genome Med. 2022;14:23. doi: 10.1186/s13073-022-01026-w. - DOI - PMC - PubMed
    1. Record C.J., Reilly M.M. Lessons and pitfalls of whole genome sequencing. Pract. Neurol. 2024;24:263–274. doi: 10.1136/pn-2023-004083. - DOI - PubMed
    1. Bansal V., Boucher C. Sequencing Technologies and Analyses: Where Have We Been and Where Are We Going? IScience. 2019;18:37–41. doi: 10.1016/j.isci.2019.06.035. - DOI - PMC - PubMed
    1. Ibañez K., Polke J., Hagelstrom R.T., Dolzhenko E., Pasko D., Thomas E.R.A., Daugherty C.L., Kasperaviciute D., Smith R.K., WGS for Neurological Diseases Group et al. Whole genome sequencing for the diagnosis of neurological repeat expansion disorders in the UK: A retrospective diagnostic accuracy and prospective clinical validation study. Lancet Neurol. 2022;21:234–245. doi: 10.1016/S1474-4422(21)00462-2. - DOI - PMC - PubMed
    1. Van der Sanden B.P.G.H., Corominas J., De Groot M., Pennings M., Meijer R.P.P., Verbeek N., Van de Warrenburg B., Schouten M., Yntema G.H., Vissers E.L.M.L., et al. Systematic analysis of short tandem repeats in 38,095 exomes provides an additional diagnostic yield. Genet. Med. 2021;23:1569–1573. doi: 10.1038/s41436-021-01174-1. - DOI - PubMed

LinkOut - more resources