. 2025 Jan 29;16(2):172.
doi: 10.3390/genes16020172.

Type 1 Diabetes Risk Variants Reduce Beta Cell Function

Affiliations

Type 1 Diabetes Risk Variants Reduce Beta Cell Function

Wiktoria Ratajczak et al. Genes (Basel). .

Abstract

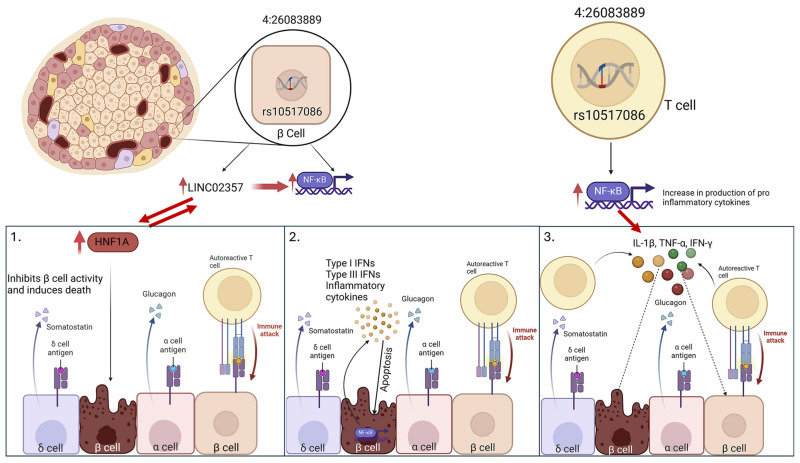
Introduction: The variants rs10517086 and rs1534422 are predictive of type 1 diabetes mellitus (T1DM) development and poor residual β cell function within the first year of diagnosis. However, the mechanism by which risk is conferred is unknown. We explored the impact of both variants on β cell function in vitro and assessed their relationship with C-peptide in people with T1DM and type 2 diabetes mellitus (T2DM).

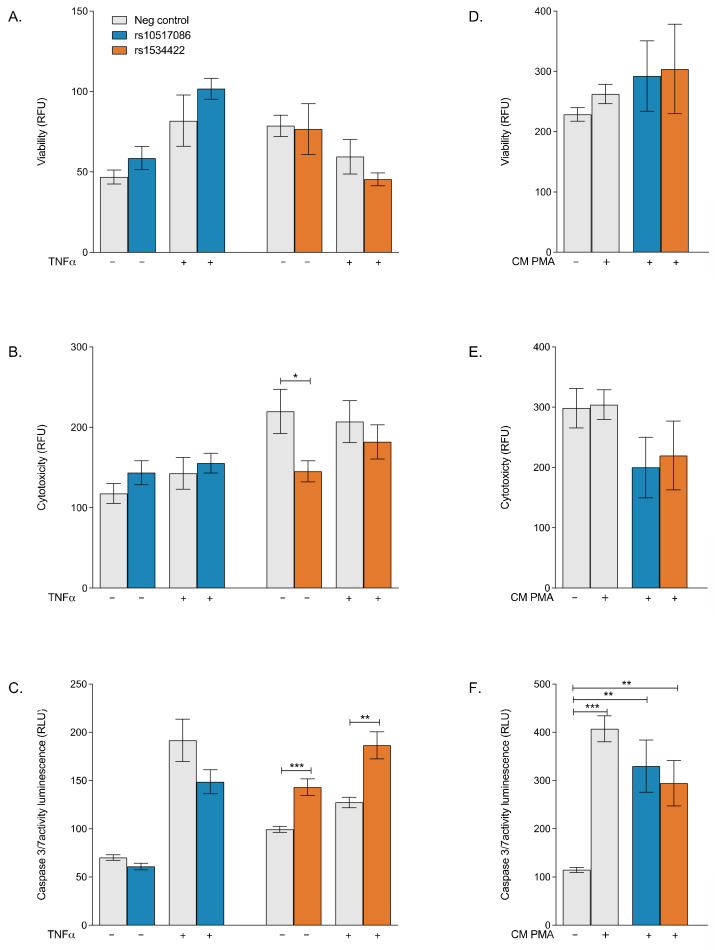
Methods: Using CRISPR/Cas9, the variants were introduced into a β cell line (BRIN-BD11) and a T cell line (Jurkat cells) from which the conditioned media was applied to otherwise healthy β cells to model the inflammatory environment associated with these variants.

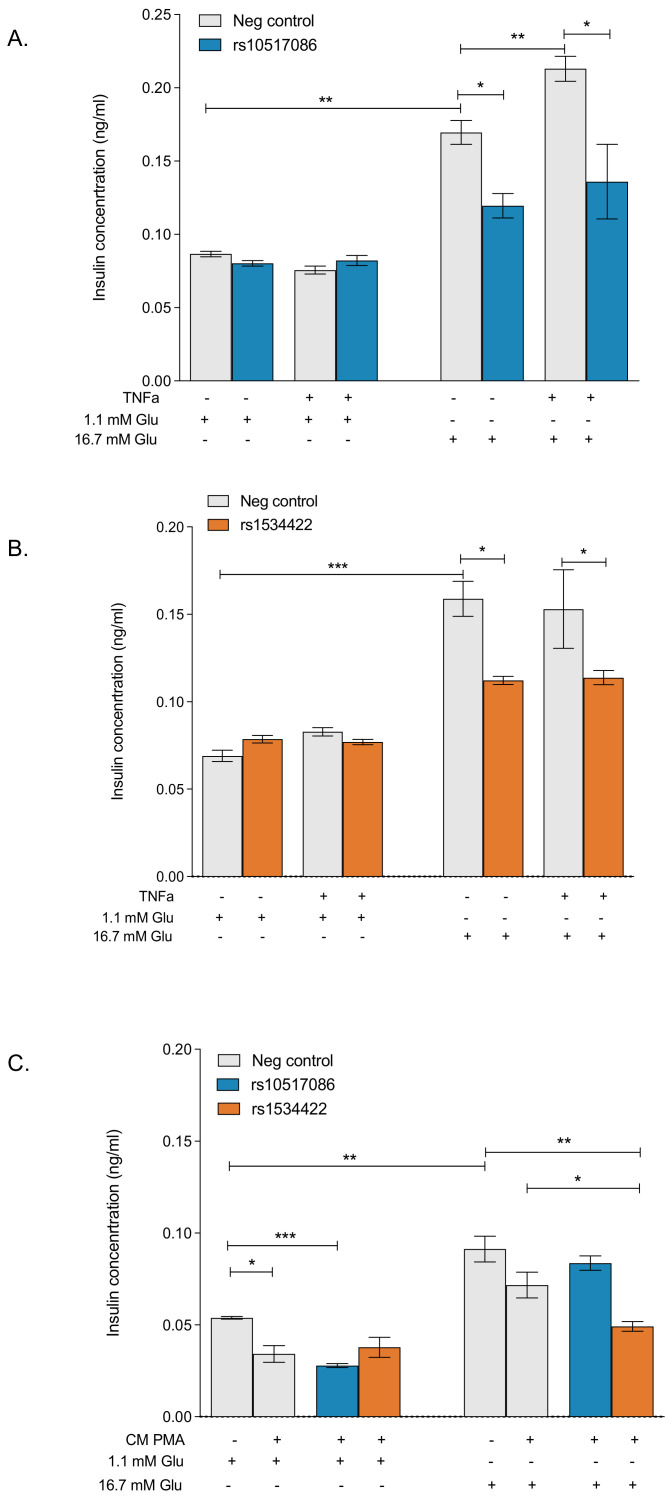
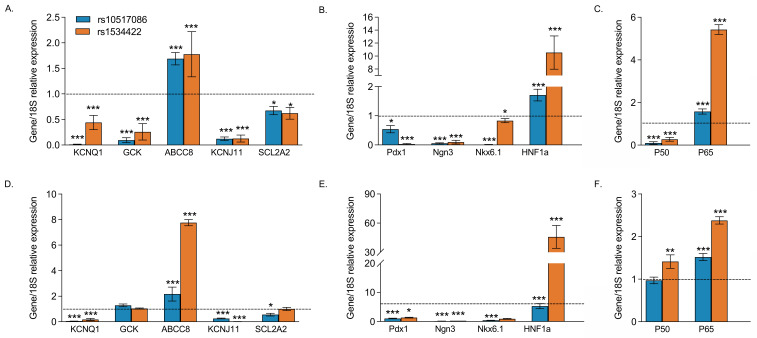
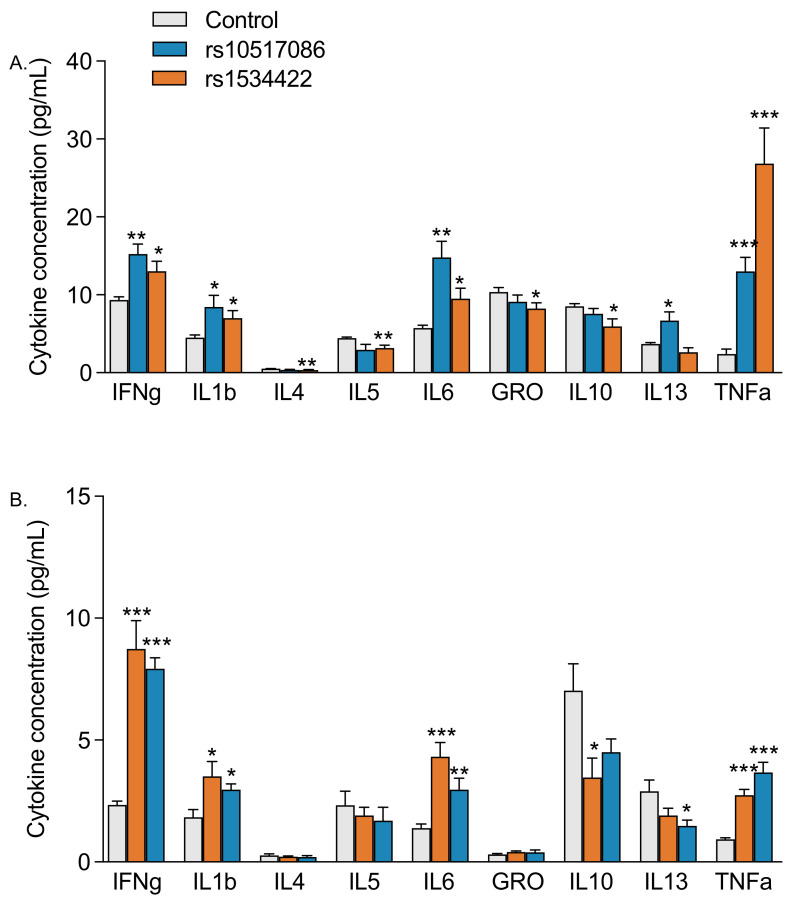
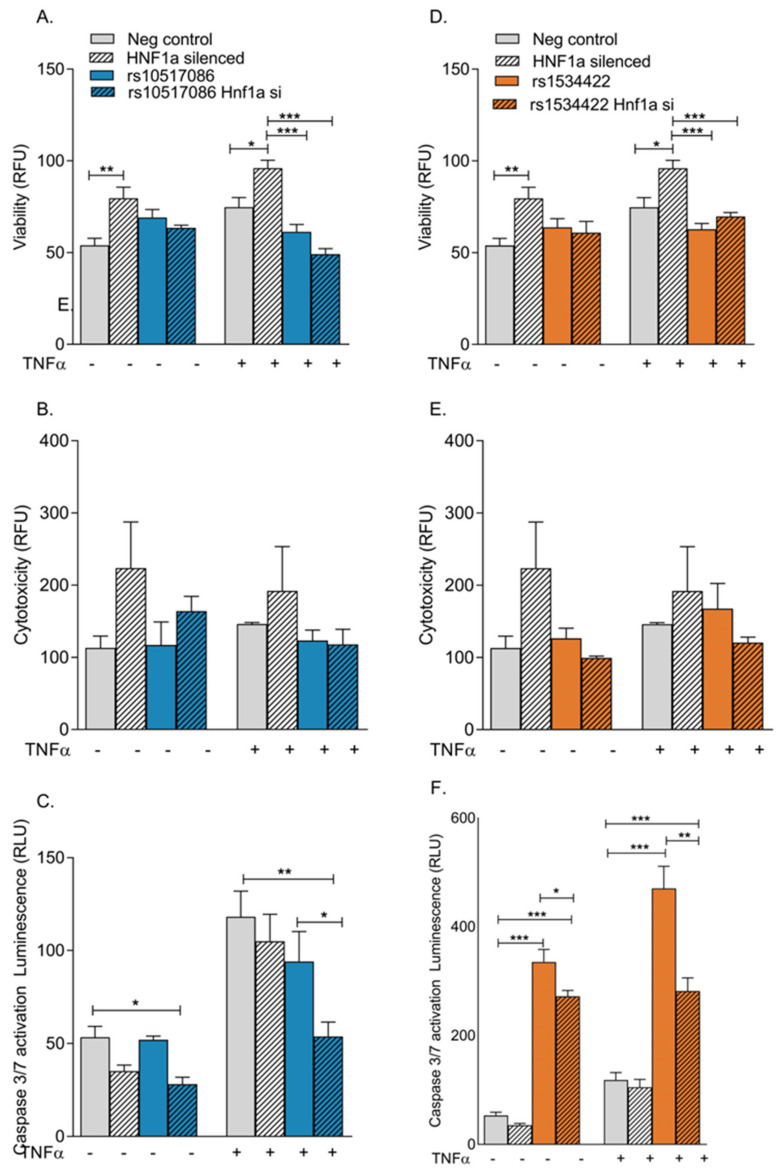
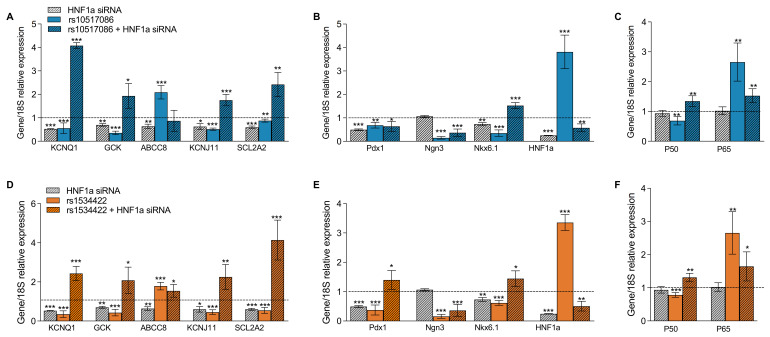
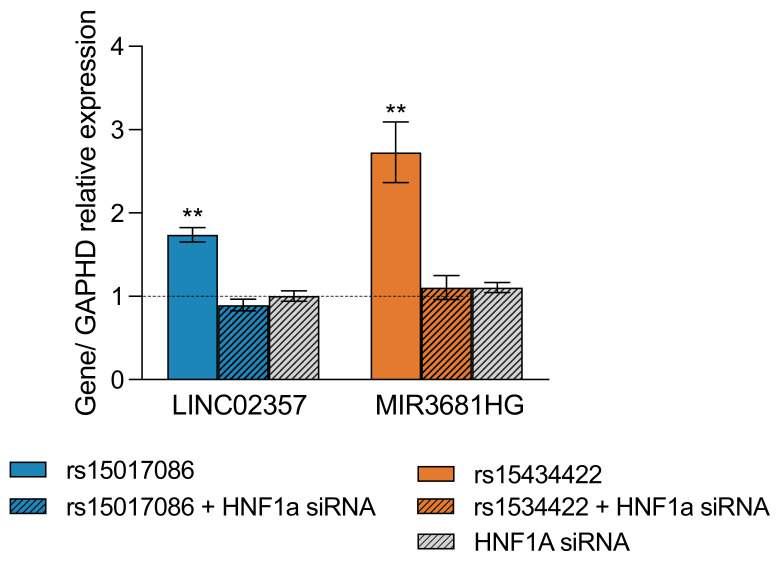
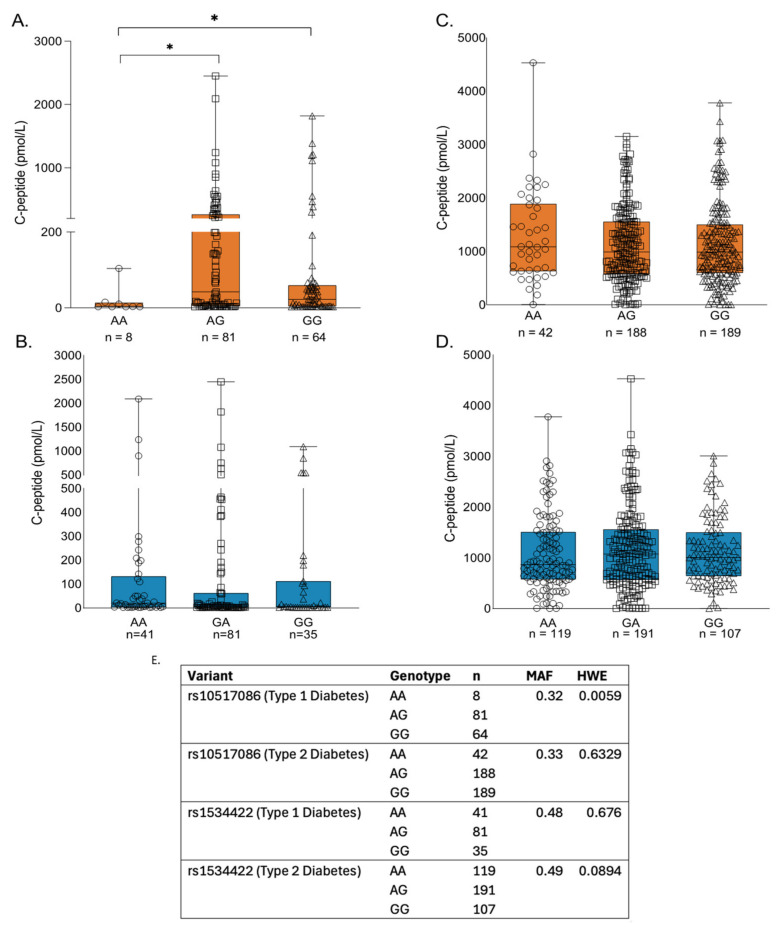
Results: Both variants significantly reduced glucose-stimulated insulin secretion, increased production of pro-inflammatory cytokines and reduced expression of several β cell markers and transcription factors (KCNJ11, KCNQ1, SCL2A2, GCK, NKX6.1, Pdx1 NGN3). However, HNF1A was significantly upregulated in the presence of both variants. We subsequently silenced HNF1A in variant expressing BRIN-BD11 cells using siRNA and found that gene expression profiles were normalised. Induction of each variant significantly increased expression of the lncRNAs they encode, which was normalised upon HNF1A silencing. Analysis of the DARE (Diabetes Alliance for Research in England) study revealed an association of rs10517086_A genotype with C-peptide in 153 individuals with T1DM, but not in 417 people with T2DM.

Conclusions: These data suggest that rs1534422 and rs10517086 exert multiple insults on the β cell through excessive upregulation of HNF1A and induction of pro-inflammatory cytokines, and highlight their utility as prognostic markers of β cell function.

Keywords: inflammation; risk variants; type 1 diabetes; β cells.


Conflict of interest statement

The authors declare no conflicts of interest.

Figures

Figure 1
Figure 1
Impact of T1D risk variants on viability, cytotoxicity and apoptosis. rs10517086 and rs1534422 were induced in both BRIN-BD11 cells and Jurkat cells. BRIN-BD11 cells were exposed to 10 ng/mL TNFa for 1 h (AC) or conditioned media from Jurkat cells exposed to 10 nM PMA (CM PMA) for 24 h (DF). The impact on cell viability (A,D), cytotoxicity (B,E) and apoptosis (C,F) was assessed using the ApoTox-Glo Triplex Assay (Promega). Data are presented as mean ± SEM (n = 5–6 for all experiments). * p < 0.05, ** p < 0.01, *** p < 0.001 compared with corresponding control (unpaired t-test). TNFa, tumour necrosis factor a; PMA, phorbol 12-myristate 13-acetate.
Figure 2
Figure 2
Effect of T1D risk variants on glucose-stimulated insulin secretion. rs10517086 and rs1534422 were induced in both BRIN-BD11 cells and Jurkat cells. BRIN-BD11 cells were exposed to 10 ng/mL TNFa for 1 h (A,B) or conditioned media from Jurkat cells exposed to 10 nM PMA (CM PMA) for 24 h (C). The impact on basal (1.1 mM) and stimulated (16.7 mM) glucose induced insulin secretion was determined by ELISA. Data are presented as mean ± SEM (n = 4–6 for all experiments). * p < 0.05, ** p < 0.01, *** p < 0.001 compared with corresponding control (unpaired t-test). TNFa, tumour necrosis factor a; PMA, phorbol 12-myristate 13-acetate.
Figure 3
Figure 3
Impact of T1D risk variants on expression of islet and inflammatory genes. rs10517086 and rs1534422 were induced in both BRIN-BD11 cells and Jurkat cells. BRIN-BD11 cells were exposed to 10 ng/mL TNFa for 1 h (AC) or conditioned media from Jurkat cells exposed to 10 nM PMA (CM PMA) for 24 h (DF). The impact on the mRNA expression of β cell markers (A,D), islet transcription factors (B,E) and inflammatory markers (C,F) was assessed by qPCR and standardised against the corresponding control using 2ΔCt. Hashed lines present expression levels in control samples. Data are presented as mean ± SEM (n = 3–4 for all experiments). * p < 0.05, ** p < 0.01, *** p < 0.001 compared with corresponding control (unpaired t-test).
Figure 4
Figure 4
Impact of T1D risk variants on the secretion of inflammatory markers. rs10517086 and rs1534422 were induced in both BRIN-BD11 cells and Jurkat cells. BRIN-BD11 cells were exposed to 10 ng/mL TNFa for 1 h (A) and Jurkat cells exposed to 10 nM PMA (CM PMA) for 24 h (B) and the media collected. The impact of variants on the profile of secreted cytokines was determined by the Mesoscale V-PLEX Proinflammatory Panel. Data are presented as mean ± SEM (n = 6 for all experiments). * p < 0.05, ** p < 0.01, *** p < 0.001 compared with corresponding control (unpaired t-test). TNFa, tumour necrosis factor a; PMA, phorbol 12-myristate 13-acetate.
Figure 5
Figure 5
The impact of HNF1A silencing on viability, cytotoxicity and apoptosis of cells expressing T1D risk variants. rs10517086 and rs1534422 were induced in BRIN-BD11 cells, the cells were then treated with 100 ng siRNA against HNF1A or a negative control (scrambled siRNA) and then exposed to 10 ng/mL TNFa for 1 h. The impacts on cell viability (A,D), cytotoxicity (B,E) and apoptosis (C,F) were assessed using the ApoTox-Glo Triplex Assay (Promega). Data are presented as mean ± SEM (n = 4–6 for all experiments). * p < 0.05, ** p < 0.01, *** p < 0.001 compared with corresponding control (unpaired t-test). TNFa, tumour necrosis factor a.
Figure 6
Figure 6
Impact of HNF1A silencing in cells expressing T1D risk variants on expression of islet and inflammatory genes. rs10517086 and rs1534422 were induced in BRIN-BD11 cells, which were subsequently treated with 100 ng siRNA against HNF1A or a negative control (scrambled siRNA) and then exposed to 10 ng/mL TNFa for 1 h. The impact on the mRNA expression of β cell markers (A,D), islet transcription factors (B,E) and inflammatory markers (C,F) was assessed by qPCR and standardised against the corresponding control using 2ΔCt. Hashed lines present expression levels in control samples. Data are presented as mean ± SEM (n = 4 for all experiments). * p < 0.05, ** p < 0.01, *** p < 0.001 compared with corresponding control (unpaired t-test).
Figure 7
Figure 7
rs1534422 and increase expression of encoded lncRNAs. rs10517086 and rs1534422 were induced in BRIN-BD11 cells. The expression of LINC023457 (encoded by rs10517086) and MIR3681HG (encoded by rs1534422) were investigated by qPCR in the presence or absence of 100 ng siRNA against HNF1A or a negative control (scrambled siRNA). Expression was standardized against the corresponding control (represented by the hashed line) using 2ΔCt. Data are presented as mean ± SEM (n = 3 for all experiments). ** p < 0.01, compared with the corresponding control (unpaired t-test).
Figure 8
Figure 8
Relationship of T1D risk variants with C-peptide in individuals from the DARE study. The relationship with C-peptide of rs10517086 (A,C) and rs1534422 (B,D) was investigated in individuals with T1D (A,B) and T2D (C,D) recruited to the DARE (Diabetes Alliance for Research in England) study. C-peptide levels were compared for each genotype in both variants. (E). Minor allele frequencies (MAF) and Hardy–Weinberg equilibrium (HWE) for each variant. * p < 0.05 compared with corresponding control (Mann–Whitney test).
Figure 9
Figure 9
Mechanisms of rs15017086 action in the β cell. rs10517086 leads to a triple insult to the β cell by upregulating HNF1A expression through upregulated LINC02357, enhancing cytokine release from the β cell itself, and by creating an inflammatory environment by T cells.

Similar articles

References

    1. Burrack A.L., Martinov T., Fife B.T. T Cell-Mediated Beta Cell Destruction: Autoimmunity and Alloimmunity in the Context of Type 1 Diabetes. Front. Endocrinol. 2017;8:343. doi: 10.3389/fendo.2017.00343. - DOI - PMC - PubMed
    1. Cnop M., Welsh N., Jonas J.-C., Jörns A., Lenzen S., Eizirik D.L. Mechanisms of pancreatic β-cell death in type 1 and type 2 diabetes: Many differences, few similarities. Diabetes. 2005;54((Suppl. S2)):S97–S107. doi: 10.2337/diabetes.54.suppl_2.S97. - DOI - PubMed
    1. Moin A.S.M., Butler A.E. Alterations in β Cell Identity in Type 1 and Type 2 Diabetes. Curr. Diabetes Rep. 2019;19:83. doi: 10.1007/s11892-019-1194-6. - DOI - PMC - PubMed
    1. Kany S., Vollrath J.T., Relja B. Cytokines in Inflammatory Disease. Int. J. Mol. Sci. 2019;20:6008. doi: 10.3390/ijms20236008. - DOI - PMC - PubMed
    1. Atkinson M.A., Eisenbarth G.S., Michels A.W. Type 1 diabetes. Lancet. 2014;383:69–82. doi: 10.1016/S0140-6736(13)60591-7. - DOI - PMC - PubMed

MeSH terms

LinkOut - more resources