. 2025 Feb 15;16(2):224.
doi: 10.3390/genes16020224.

The Impact of the Competition on miRNA, Proteins, and Metabolites in the Blood Exosomes of the Yili Horse

Affiliations

The Impact of the Competition on miRNA, Proteins, and Metabolites in the Blood Exosomes of the Yili Horse

Xinxin Yuan et al. Genes (Basel). .

Abstract

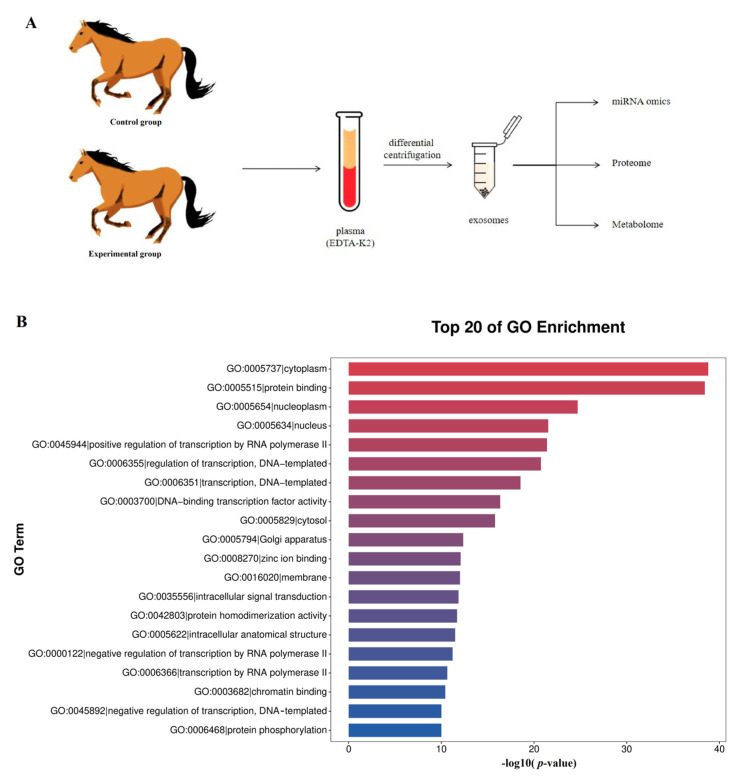
Purpose: Horse racing may cause stress-induced physiological changes and tissue damage in horses, but the changes in miRNA expression, protein expression, and metabolic substances in the plasma exosomes of the Yili horse after racing are still unclear. This study detected miRNA, protein expression, and metabolic substances in the plasma exosomes of Yili horses before and after competition, providing new insights for post-race recovery and care of Yili horses.

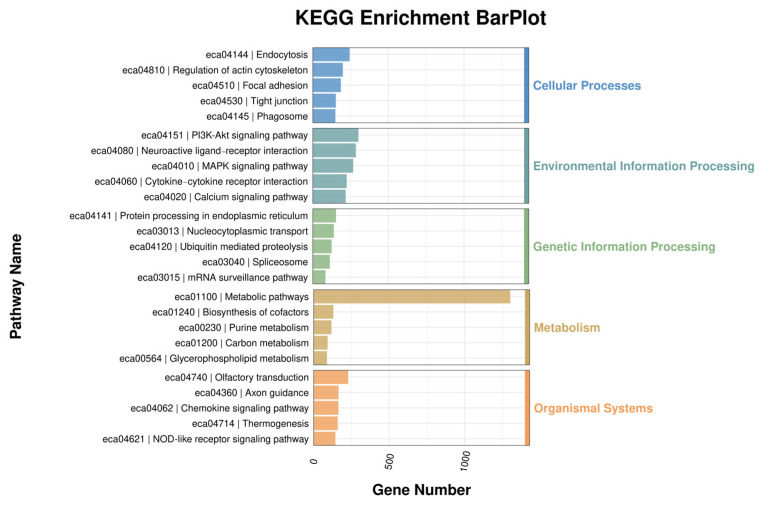
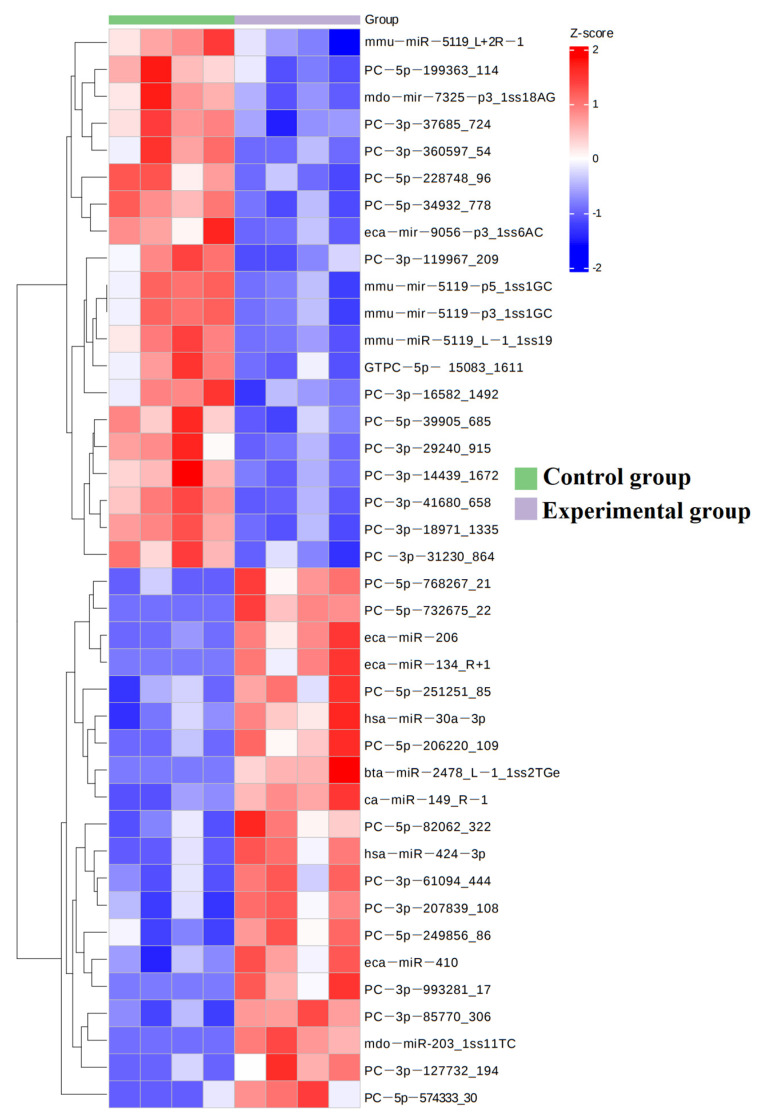
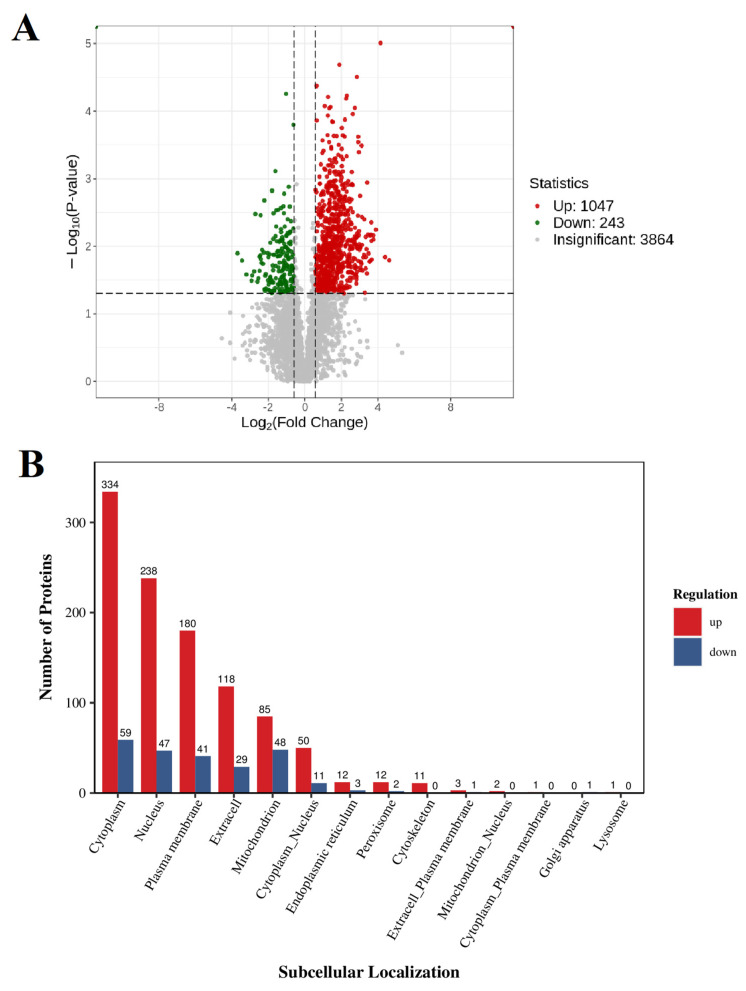
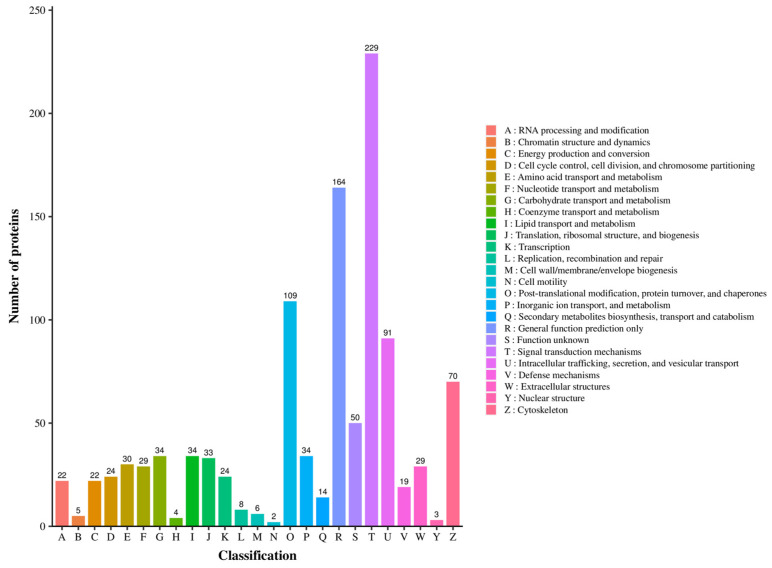
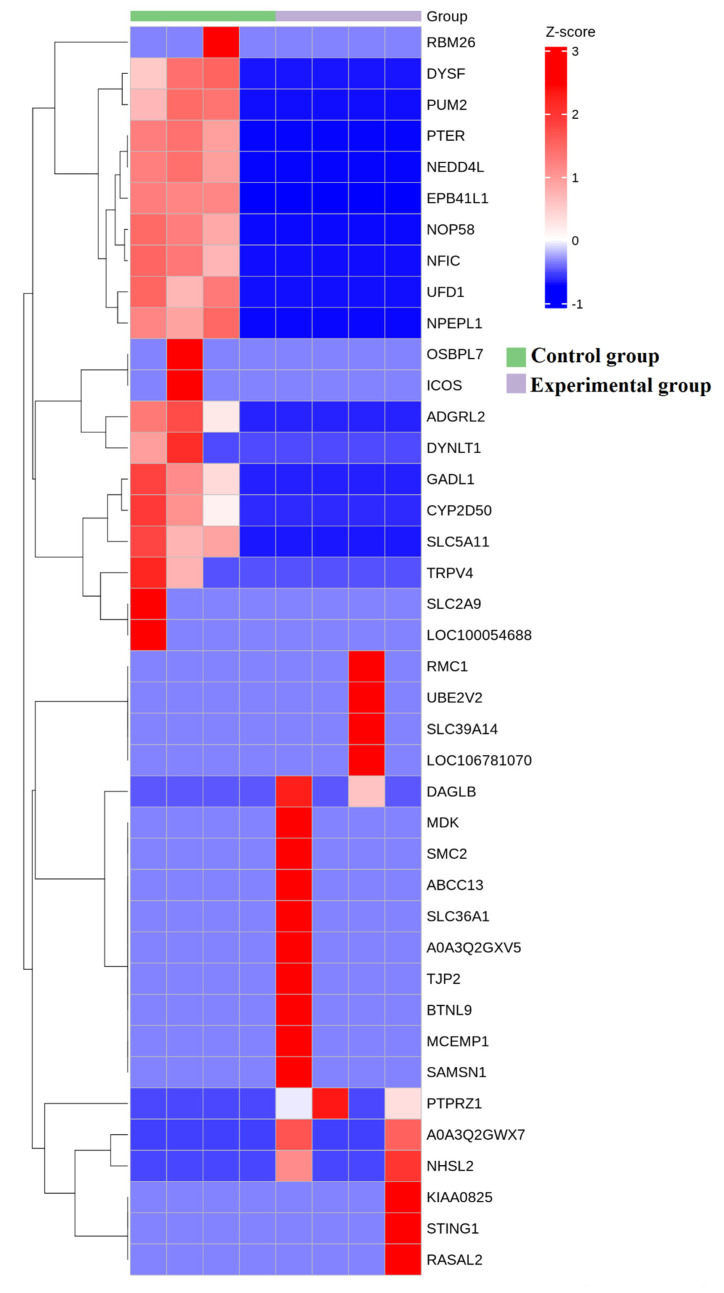
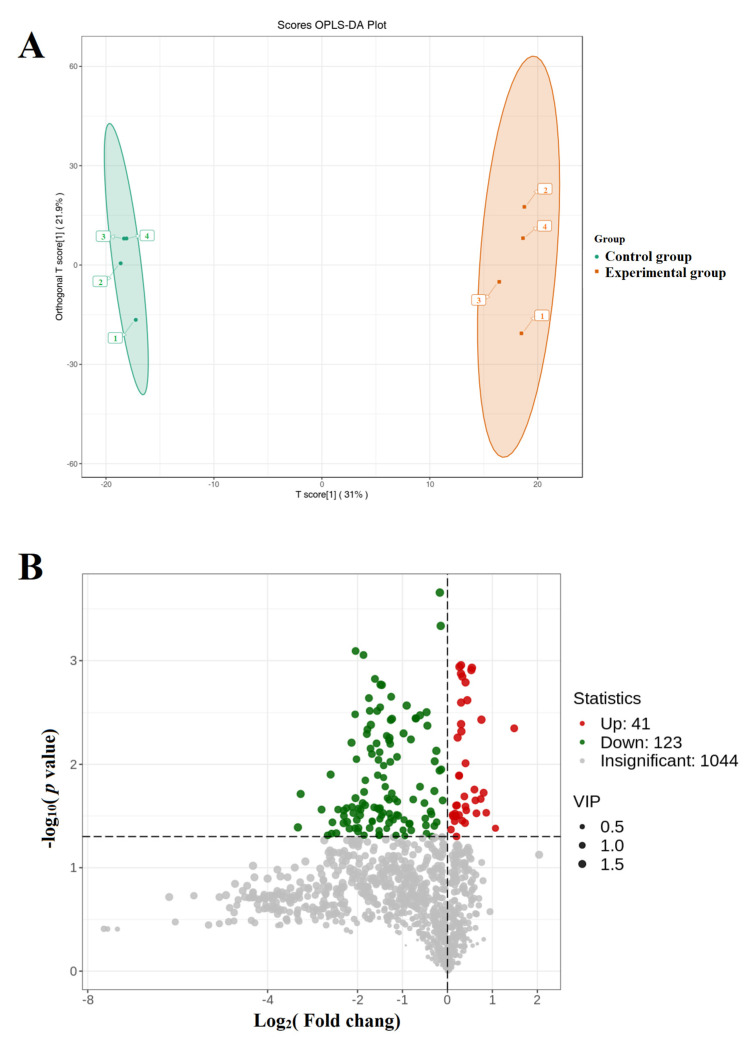
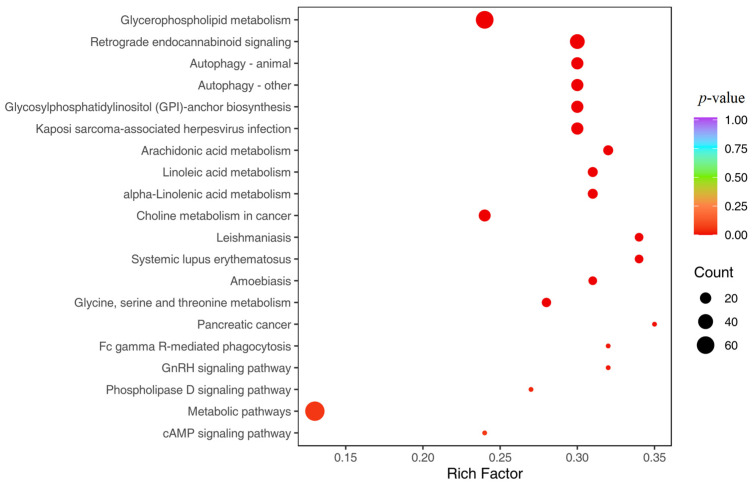
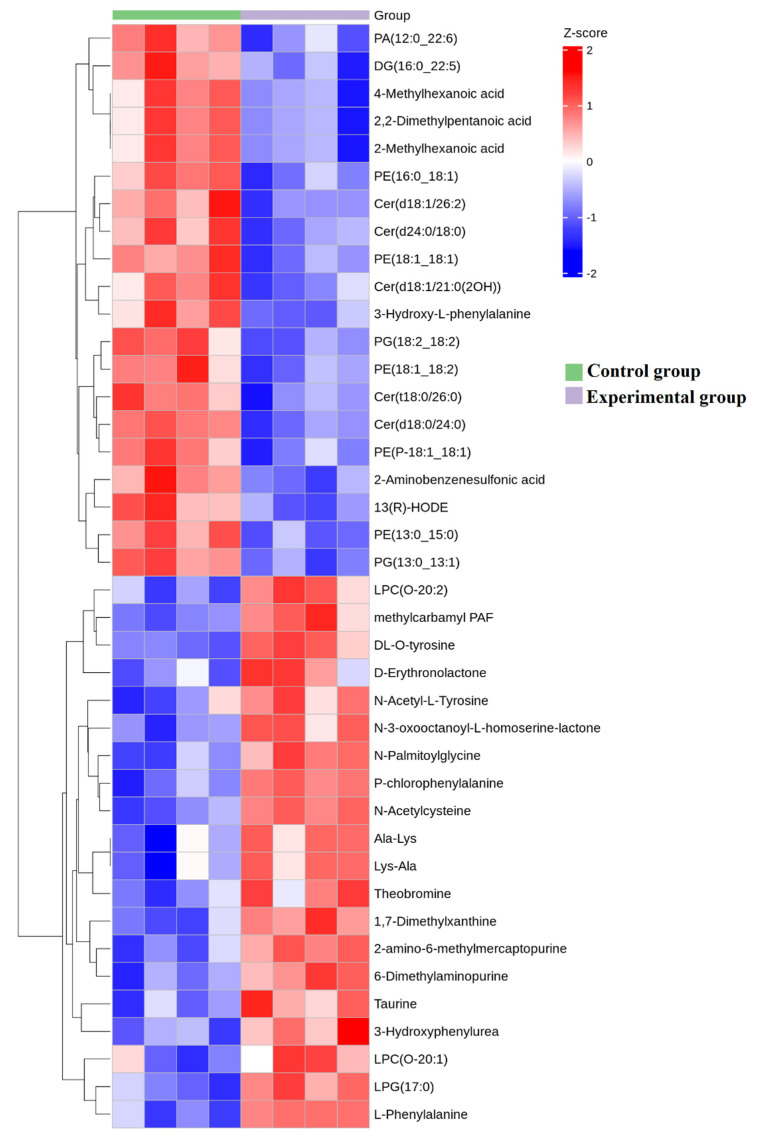
Method: Eight three-year-old Yili horses that had undergone training were selected as the research subjects, with four horses that had not competed as the control group and four horses that had participated in the competition for half an hour as the training group. Extract whole blood and separate plasma from two groups of horses, and then extract plasma exosomes; MiRNAs, proteins, and metabolites in extracellular vesicles were detected and analyzed using miRNAomics, proteomics, and metabolomics. P Result: After the competition, the levels of miRNAs related to the cytoplasm and nucleus in Yili horse plasma exosomes increased, and miRNAs related to the transcription and transcriptional regulation of biological processes significantly increased. The levels of proteins related to the cytoplasm and nucleus also increased, and the levels of proteins related to cell signaling function increased, carbohydrates and their metabolites were significantly reduced.

Conclusions: The competition process causes significant changes in the miRNA, proteomics, and metabolomics of plasma exosomes in the Yili horses, which are mainly related to metabolic regulation.

Keywords: Yili horse; competition; extracellular vesicles; metabolomics; miRNAomics; proteomics.


Conflict of interest statement

The authors declare no conflict of interest.

Figures

Figure 1
Figure 1
(A) Roadmap of this research: after collecting plasma from two groups of Yili horses, extracellular vesicles were isolated and subjected to miRNA omics, proteomics, and metabolomics detection. (B) Analysis of miRNA GO enriched cellular components for differential expression of plasma exosomes between the two groups: the vertical axis is an annotation of the cell components shown in each panel, and the horizontal axis displays the differences in different cell components.
Figure 2
Figure 2
KEGG enrichment analysis chart. KEGG enrichment analysis was performed on the biological processes of differentially expressed miRNAs in horse plasma exosomes between the control group and the training group.
Figure 3
Figure 3
MiRNA composition heatmap, arranged in the order of sample grouping. In the figure, the red color block represents a higher abundance of the genus in this sample compared to other samples, while the blue color block represents a lower abundance of the miRNA in this sample compared to other samples.
Figure 4
Figure 4
(A) Volcanic diagram of differential proteins in extracellular vesicles. The horizontal axis represents log2, the vertical axis represents the log10 p value, and the red and green scatter dots represent upregulated and downregulated differentially expressed proteins, respectively. The gray dots represent proteins with no significant differences. (B) A bar chart comparing the up- and downregulation of subcellular localization results, where the horizontal axis represents the subcellular region, the vertical axis represents the number of differentially expressed proteins annotated in that subcellular region, and the red and blue colors represent upregulated and downregulated differentially expressed proteins, respectively.
Figure 5
Figure 5
Cluster of orthologous groups of proteins bar chart. The horizontal axis represents the functional classification of KOG, the vertical axis represents the number of differentially expressed proteins annotated to corresponding functions, and the legend on the right represents the description of functional classification.
Figure 6
Figure 6
Protein composition heatmap, arranged in the order of sample grouping. In the figure, the red color block represents a higher abundance of the genus in this sample compared to other samples, while the blue color block represents a lower abundance of the proteins in this sample compared to other samples.
Figure 7
Figure 7
(A) OPLS-DA score chart. The horizontal axis represents the predicted principal components, and the difference between groups can be seen in the direction of the horizontal axis. The vertical axis represents the orthogonal principal components, and the difference within the group can be seen in the direction of the vertical axis. The percentage represents the explanatory power of the component on the dataset. Each point in the figure represents a sample, and samples in the same group are represented by the same color. Group represents grouping. (B) Volcanic diagram of differential proteins in extracellular vesicles. The horizontal axis represents log2, the vertical axis represents the logl0 p-value, and the red and green dots represent upregulated and downregulated differential proteins, respectively.
Figure 8
Figure 8
KOG enrichment analysis bubble chart. The horizontal axis represents the enrichment factor (DifRatio/BgLatio ratio), with a higher enrichment factor indicating a higher degree of enrichment of differentially expressed proteins, and the vertical axis represents the functional description of KOG. The color of the dots changes from blue to red, representing the change in p-value from large to small. The smaller the p-value, the more statistically significant it is. The size of the dots represents the number of differentially expressed proteins annotated with corresponding functions.
Figure 9
Figure 9
Metabolite composition heatmap, arranged in the order of sample grouping. In the figure, the red color block represents a higher abundance of the genus in this sample compared to other samples, while the blue color block represents a lower abundance of the metabolites in this sample compared to other samples.
Figure 10
Figure 10
Correlation analysis: nine-quadrant chart in each differential group, selecting the correlation parts that meet the Pearson correlation coefficient with an absolute value greater than 0.8 and a p-value less than 0.05, where each point represents a pair of correlation relationships, the horizontal axis represents the Log2FC of the gene, and the vertical axis represents the Log2FC of the metabolite. It is divided into 1–9 quadrants using black dashed lines from left to right and from top to bottom, where miRNA and metabolites in quadrant 5 are not differentially expressed. The miRNAs in quadrants 3 and 7 have a positive correlation with metabolites, and the expression changes of metabolites may be positively regulated by miRNAs. The miRNAs in quadrants 1 and 9 have an inconsistent regulatory trend with metabolites, and the expression changes of metabolites may be negatively regulated by genes. The expression of metabolites in quadrants 2, 4, 6, and 8 remains unchanged, and miRNA is upregulated or downregulated, or miRNA expression remains unchanged, while metabolites are upregulated or downregulated.
Figure 11
Figure 11
Correlation clustering heatmap, where each row represents a gene and each column represents a metabolite. Red represents a positive correlation between genes and metabolites, while green represents a negative correlation between genes and metabolites.

Similar articles

Cited by

References

    1. Hus A., McCulloch S.P. The Political Salience of Animal Protection in the Republic of Ireland (2011–2020): What Do Irish Political Parties Pledge on Animal Welfare and Wildlife Conservation? Animals. 2024;14:3619. doi: 10.3390/ani14243619. - DOI - PMC - PubMed
    1. Hitchens P.L., Hill A.E., Stover S.M. Relationship Between Historical Lameness, Medication Usage, Surgery, and Exercise with Catastrophic Musculoskeletal Injury in Racehorses. Front. Veter. Sci. 2018;5:217. doi: 10.3389/fvets.2018.00217. - DOI - PMC - PubMed
    1. White N., Pelzel-McCluskey A. Cross-Sectional Survey of Horse Owners to Assess Their Knowledge and Use of Biosecurity Practices for Equine Infectious Diseases in the United States. Animals. 2023;13:3550. doi: 10.3390/ani13223550. - DOI - PMC - PubMed
    1. Wilson J.M., McKenzie E., Duesterdieck-Zellmer K. International Survey Regarding the Use of Rehabilitation Modalities in Horses. Front. Veter. Sci. 2018;5:120. doi: 10.3389/fvets.2018.00120. - DOI - PMC - PubMed
    1. Egan S., Brama P., McGrath D. Irish Equine Industry Stakeholder Perspectives of Objective Technology for Biomechanical Analyses in the Field. Animals. 2019;9:539. doi: 10.3390/ani9080539. - DOI - PMC - PubMed

LinkOut - more resources