Review
. 2025 Feb 7;30(4):759.
doi: 10.3390/molecules30040759.

Machine Learning-Assisted High-Throughput Screening for Electrocatalytic Hydrogen Evolution Reaction

Affiliations
Review

Machine Learning-Assisted High-Throughput Screening for Electrocatalytic Hydrogen Evolution Reaction

Guohao Yin et al. Molecules. .

Abstract

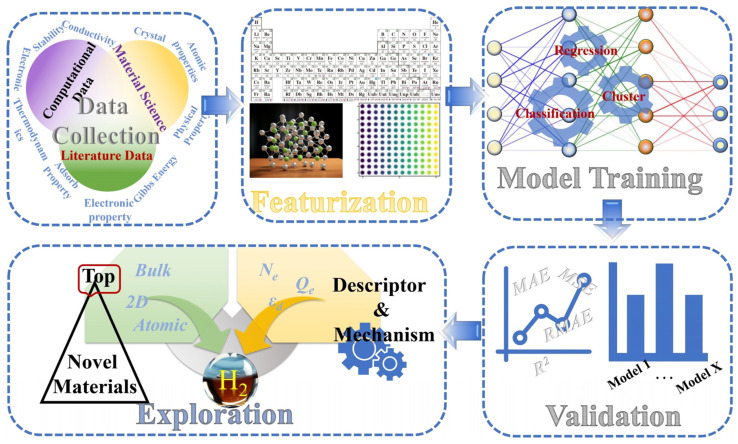
Hydrogen as an environmentally friendly energy carrier, has many significant advantages, such as cleanliness, recyclability, and high calorific value of combustion, which makes it one of the major potential sources of energy supply in the future. Hydrogen evolution reaction (HER) is an important strategy to cope with the global energy shortage and environmental degradation, and given the large cost involved in HER, it is crucial to screen and develop stable and efficient catalysts. Compared with the traditional catalyst development model, the rapid development of data science and technology, especially machine learning technology, has shown great potential in the field of catalyst development in recent years. Among them, the research method of combining high-throughput computing and machine learning has received extensive attention in the field of materials science. Therefore, this paper provides a review of the recent research on combining high-throughput computing with machine learning to guide the development of HER electrocatalysts, covering the application of machine learning in constructing prediction models and extracting key features of catalytic activity. The future challenges and development directions of this field are also prospected, aiming to provide useful references and lessons for related research.

Keywords: density functional theory; high throughput screening; hydrogen evolution reaction; machine learning.


Conflict of interest statement

The authors declare no conflicts of interest.

Figures

Figure 1
Figure 1
(a,b), respectively, represent the HER mechanisms in different reaction environments. The * represents the adsorbed state, and H* indicates hydrogen in the adsorbed state. Grey and green represent hydrogen from different sources, blue represents oxygen, and yellow represents electrons.
Figure 1
Figure 1
(a,b), respectively, represent the HER mechanisms in different reaction environments. The * represents the adsorbed state, and H* indicates hydrogen in the adsorbed state. Grey and green represent hydrogen from different sources, blue represents oxygen, and yellow represents electrons.
Figure 2
Figure 2
The schematic diagram for the workflow of the machine learning in HER electrocatalysts exploration. Reproduced from Ref. [36] with permission.
Figure 3
Figure 3
(a) Clusters of a given composition (e.g., the depicted Cu13Co42) were generated automatically by Monte Carlo assuming various combinations of interaction and segregation energies. Experimentally observable composites such as core–shell, segregated, ordered, and random as well as structures in-between emerged naturally. (b) Learning curve of KRR. The errors are averaged over 20 randomized runs and the error bars indicate the standard deviation of those errors. Training, validation and test set are in blue, yellow, and green, respectively. (c) Calculated vs. predicted hydrogen adsorption energy of 1767 DFT calculations. The deviation of data points from the diagonal directly indicates the disparity between predicted and calculated values, thereby assessing the model’s adsorption energy prediction accuracy. Reproduced from Ref. [48] with permission.
Figure 4
Figure 4
(a) End-to-end workflow for the jagged Pt nanowire simulation. (b) ΔrGads prediction machine-learning architecture and the mean absolute error (MeanAE) for the tested models. (c) Optimal Gibbs free energy of adsorption, ΔrGads,opt, vs. the pH at 0 V vs. RHE. (d) Points represent the sites and the distances between them, signifying the dissimilarity among sites, are visualized through the use of a SOAP descriptor, an average kernel, and t-SNE dimensional reduction analysis. (e) The ΔrGads values are plotted against the coordination numbers. Reproduced from Ref. [50] with permission.
Figure 5
Figure 5
(a) Rational designing of bimetallic/trimetallic hydrogen evolution reaction catalysts using supervised machine learning. (b) Plot of DFT calculated adsorption energies (ΔEcalc) versus predicted adsorption energies (ΔEpred) with its indicated Test and Train RMSE values for merged four datasets with optimized XGBR model. ML2 represents method 2 by considering merged datasets. Reproduced from Ref. [55] with permission.
Figure 6
Figure 6
(a) The optimized structures for M-NM/g-CN. (b) The formation energy and dissolution potential for M-NM/g-CN. (c) Schematic diagram of the interaction between H s orbitals and M d orbitals (NM p orbitals). (d) Gibbs free energy diagram for HER on M-B/g-CN (M = Zn, Pd, Au), M-C/g-CN (M = Ti, Pd, Ag, Ir), M-Si/g-CN (M = Ti, Cr, Mn, Co, Ni, Zn, Rh, Ag, Ir, Au), M-P/g-CN (M = Fe, Ir, Au), and M-S/g-CN (M = Ti, Fe, Ni, Nb, Re). (e) Pearson correlation coefficient between the pairwise features. (f) The feature importance calculated by RFR for ΔGH*. (g) The RMSE and the R2 on the test set of ΔGH* with RFR, GBR, GPR, SVR, and KNR algorithms. (h) The DFT calculated and machine learning predicted ΔGH* for M-Se/g-CN and M-Te/g-CN. Reproduced from Ref. [68] with permission.
Figure 7
Figure 7
(a) Structure models of chalcogenides-supported transition-metal single-atom catalysts. (b) BP neural network model. (c) Radar chart of the feature importance, squares of different colors represent different input features. (d) Heat matrix for the HER catalytic activity of M@TMC catalysts. (e) Gibbs free energy diagram of hydrogen evolution reaction of Sn@CoS and Ni@ZnS. Reproduced from Ref. [79] with permission.
Figure 8
Figure 8
(a) Mean absolute error (MAE) and coefficient of determination (R2 score) of the ABR, ENR, GBR, KNR, KRR, LAS, PLS, RFR, and RDG algorithms. Parity plots of the best-performing RFR and GBR models (b) with and (c) without cross-validation using the DFT dataset of hydrogen adsorption Gibbs free energies (ΔGH*). (d) Parity plot of predicted vs. actual ΔGH* from the GBR model with RFE–HO–LOO in the best cross-validated process. (e) Pearson correlation coefficient (PCC) heat map for the reduced set of features after recursive feature elimination (RFE), hyperparameter optimization (HO), and the leave-one-out (LOO) approach. (f) Feature importance from the mean decrease in impurity for the GBR model with RFE–HO–LOO, evaluated via 20-fold cross-validation, the black arrows denote the key descriptors highlighting the impact on the hydrogen evolution reaction (HER) activity of MXenes. (g) Alluvial diagram for the predicted ΔGH* values of 4500 MM′XT2-type MXenes. Reproduced from Ref. [87] with permission.
Figure 8
Figure 8
(a) Mean absolute error (MAE) and coefficient of determination (R2 score) of the ABR, ENR, GBR, KNR, KRR, LAS, PLS, RFR, and RDG algorithms. Parity plots of the best-performing RFR and GBR models (b) with and (c) without cross-validation using the DFT dataset of hydrogen adsorption Gibbs free energies (ΔGH*). (d) Parity plot of predicted vs. actual ΔGH* from the GBR model with RFE–HO–LOO in the best cross-validated process. (e) Pearson correlation coefficient (PCC) heat map for the reduced set of features after recursive feature elimination (RFE), hyperparameter optimization (HO), and the leave-one-out (LOO) approach. (f) Feature importance from the mean decrease in impurity for the GBR model with RFE–HO–LOO, evaluated via 20-fold cross-validation, the black arrows denote the key descriptors highlighting the impact on the hydrogen evolution reaction (HER) activity of MXenes. (g) Alluvial diagram for the predicted ΔGH* values of 4500 MM′XT2-type MXenes. Reproduced from Ref. [87] with permission.

References

    1. Chu S., Majumdar A. Opportunities and Challenges for a Sustainable Energy Future. Nature. 2012;488:294–303. doi: 10.1038/nature11475. - DOI - PubMed
    1. Cao Y., Ye R., Li D., Wang X., Liu X., Zhou L., Zhao Z. Research progress in transition metal carbides in electrocatalytic hydrogen evolution reaction. Sci. Sin.-Chim. 2024;54:1–23. doi: 10.1360/SSC-2024-0039. - DOI
    1. Zou X., Zhang Y. Noble Metal-Free Hydrogen Evolution Catalysts for Water Splitting. Chem. Soc. Rev. 2015;44:5148–5180. doi: 10.1039/C4CS00448E. - DOI - PubMed
    1. Li H., Li Y., Koper M.T.M., Calle-Vallejo F. Bond-Making and Breaking between Carbon, Nitrogen, and Oxygen in Electrocatalysis. J. Am. Chem. Soc. 2014;136:15694–15701. doi: 10.1021/ja508649p. - DOI - PubMed
    1. Zhu L., Lin H., Li Y., Liao F., Lifshitz Y., Sheng M., Lee S.-T., Shao M. A Rhodium/Silicon Co-Electrocatalyst Design Concept to Surpass Platinum Hydrogen Evolution Activity at High Overpotentials. Nat. Commun. 2016;7:12272. doi: 10.1038/ncomms12272. - DOI - PMC - PubMed

LinkOut - more resources