. 2025 Feb 15;30(4):900.
doi: 10.3390/molecules30040900.

Rifampicin Repurposing Reveals Anti-Melanogenic Activity in B16F10 Melanoma Cells

Affiliations

Rifampicin Repurposing Reveals Anti-Melanogenic Activity in B16F10 Melanoma Cells

Ye-Jin Lee et al. Molecules. .

Abstract

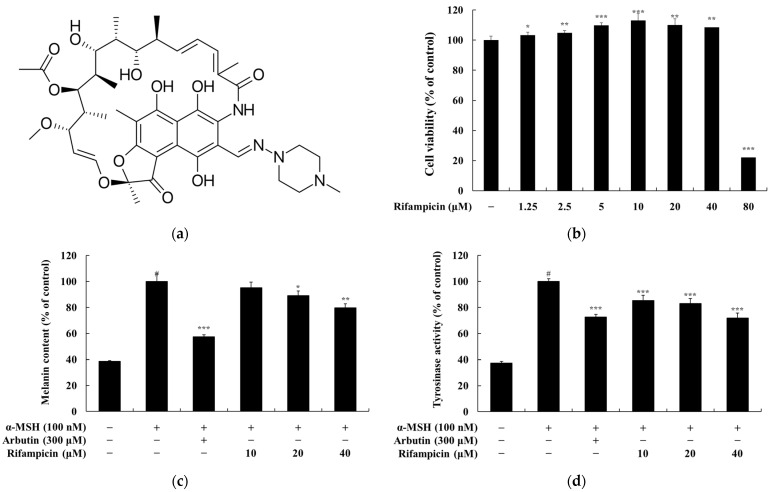
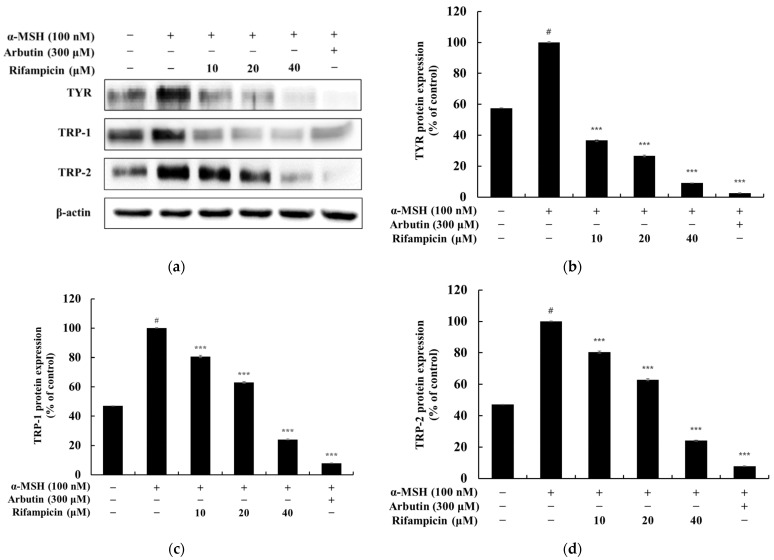
Drug repurposing is a cost-effective and innovative strategy for identifying new therapeutic applications for existing drugs, thereby shortening development timelines and accelerating the availability of treatments. Applying this approach to the development of cosmeceutical ingredients enables the creation of functional compounds with proven safety and efficacy, adding significant value to the cosmetic industry. This study evaluated the potential of rifampicin, a drug widely used for the treatment of tuberculosis and leprosy, as a cosmeceutical agent. The anti-melanogenic effects of rifampicin were assessed in B16F10 melanoma cells, showing no cytotoxicity at concentrations up to 40 µM and a significant reduction in intracellular tyrosinase activity and melanin content. Mechanistically, rifampicin reduced the expression of melanogenic enzymes, including tyrosinase, tyrosinase-related protein (TRP)-1, and TRP-2, via a protein kinase A (PKA)-dependent pathway, leading to the suppression of microphthalmia-associated transcription factor (MITF), which is a key regulator of melanogenesis. Additionally, rifampicin inhibited the p38 signaling pathway but was independent of the PI3K/protein kinase B (Akt) pathway. Furthermore, it decreased Ser9 phosphorylation, enhancing glycogen synthase kinase-3β (GSK-3β) activity, promoted β-catenin phosphorylation, and facilitated β-catenin degradation, collectively contributing to the inhibition of melanin synthesis. To evaluate the topical applicability of rifampicin, primary human skin irritation tests were conducted, and no adverse effects were observed at concentrations of 20 µM and 40 µM. These findings demonstrate that rifampicin inhibits melanogenesis through multiple signaling pathways, including PKA, MAPKs, and GSK-3β/β-catenin. This study highlights the potential of rifampicin to be repurposed as a topical agent for managing hyperpigmentation disorders, offering valuable insights into novel therapeutic strategies for pigmentation-related conditions.

Keywords: B16F10; PI3K/Akt pathway; PKA pathway; cosmeceutical; drug repurposing; hyperpigmentation; melanogenesis; rifampicin; β-catenin.


Conflict of interest statement

The authors declare no conflicts of interest.

Figures

Figure 1
Figure 1
Overview of the study findings presented in four panels: (ad). (a) depicts the chemical structure of rifampicin, highlighting its molecular framework. (b) presents the effect of rifampicin on the viability of B16F10 melanoma cells after 72 h of treatment at concentrations ranging from 1.25 μM to 80 μM, as assessed by the MTT assay. Cell viability is expressed as a percentage relative to untreated control cells with data reported as the mean ± SD from three independent experiments. (c) demonstrates the inhibitory effect of rifampicin on melanin production in α-MSH-stimulated B16F10 cells treated with rifampicin at 10, 20, and 40 μM for 72 h. α-MSH (100 nM) was used as a negative control, and arbutin (300 μM) was used as a positive control. (d) illustrates the effect of rifampicin on tyrosinase activity in α-MSH-stimulated B16F10 cells under the same experimental conditions as (c). For panels (bd), results are expressed as the mean ± SD from three independent experiments. Statistical significance is indicated as # p < 0.001 compared to the untreated control group and * p < 0.05, ** p < 0.01, *** p < 0.001 compared to the α-MSH-treated group.
Figure 2
Figure 2
Effect of rifampicin on tyrosinase (TYR), TRP-1, and TRP-2 protein expression in α-MSH-stimulated B16F10 cells. Western blot analysis was performed to determine the protein expression levels of tyrosinase, TRP-1, and TRP-2 after 48 h of treatment with rifampicin. The results are presented in four panels: (ad). (a) shows the Western blot results for tyrosinase, TRP-1, and TRP-2 proteins normalized to β-actin as the loading control. (b) presents the quantification of tyrosinase protein expression relative to β-actin, which is expressed as a percentage of the untreated control. (c) illustrates the relative expression of TRP-1 normalized to β-actin with untreated cells set at 100%. (d) displays the normalized expression of TRP-2 relative to β-actin. α-MSH (100 nM) was used as a negative control, and arbutin (300 μM) was used as a positive control. Protein band intensities were quantified using ImageJ software (version 9.4.0), normalized to β-actin, and expressed as the mean ± SD from at least three independent experiments. Statistical significance is denoted as # p < 0.001 compared to the untreated control group and *** p < 0.001 compared to the α-MSH-treated group.
Figure 3
Figure 3
Effect of rifampicin on MITF protein expression in α-MSH-stimulated B16F10 cells. Western blot analysis was conducted to evaluate MITF protein expression after 24 h of treatment with rifampicin. The results are presented in two panels: (a,b). (a) shows the Western blot results for MITF protein expression normalized to β-actin as the loading control. (b) presents the quantification of MITF protein expression relative to β-actin, expressed as a percentage of the untreated control group. For all panels, α-MSH (100 nM) was used as a negative control, and arbutin (300 μM) was used as a positive control. Protein band intensities were quantified using ImageJ software, normalized to β-actin, and expressed as the mean ± SD from at least three independent experiments. Statistical significance is indicated as # p < 0.001 compared to the untreated control group and *** p < 0.001 compared to the α-MSH-treated group.
Figure 4
Figure 4
Effect of rifampicin on Wnt/β-catenin signaling pathway protein expression in α-MSH-stimulated B16F10 cells. Western blot analysis was performed to evaluate the protein expression levels of Wnt/β-catenin pathway components after 24 h of treatment with rifampicin. The results are presented in four panels: (ad). (a) shows the Western blot results for β-catenin, phosphorylated β-catenin (P-β-catenin), and phosphorylated GSK3β (P-GSK3β), normalized to their respective loading controls. (b) illustrates the quantified expression of β-catenin normalized to β-actin. (c) depicts the P-GSK3β expression normalized to GSK3β. (d) presents the normalized expression of P-β-catenin relative to β-actin. For all panels, α-MSH (100 nM) was used as a negative control, and arbutin (300 μM) served as a positive control. Protein band intensities were quantified using ImageJ software, normalized to their corresponding loading controls, and expressed as the mean ± SD from at least three independent experiments. Statistical significance is indicated as # p < 0.001 compared to the untreated control group and *** p < 0.001 compared to the α-MSH-treated group.
Figure 5
Figure 5
Effect of rifampicin on AKT signaling pathway protein expression in α-MSH-stimulated B16F10 cells. Western blot analysis was performed to assess the expression of AKT and phosphorylated AKT (P-AKT) after 4 h of treatment with rifampicin. The results are presented in two panels: (a,b). (a) displays the Western blot results showing the expression levels of AKT and P-AKT proteins normalized to their respective controls. (b) quantifies the relative expression of P-AKT normalized to total AKT, which was expressed as a percentage of the untreated control group. For all panels, α-MSH (100 nM) was used as a negative control, and arbutin (300 μM) served as a positive control. Protein band intensities were quantified using ImageJ software, normalized to their respective controls, and expressed as the mean ± SD from at least three independent experiments. Statistical significance is indicated as # p < 0.001 compared to the untreated control group and *** p < 0.001 compared to the α-MSH-treated group.
Figure 6
Figure 6
Effect of rifampicin on p38 protein expression in α-MSH-stimulated B16F10 cells. Western blot analysis was conducted to evaluate the expression levels of p38 and phosphorylated p38 (P-p38) proteins after 3 h of treatment with rifampicin. The results are presented in two panels: (a,b). (a) shows the Western blot results for p38 and P-p38 proteins with β-actin used as the loading control to ensure equal protein loading. (b) quantifies the relative expression of P-p38 normalized to total p38, which is expressed as a percentage of the untreated control group. For all panels, α-MSH (100 nM) was used as a negative control, and arbutin (300 μM) served as a positive control. Protein band intensities were quantified using ImageJ software, normalized to the corresponding loading controls, and expressed as the mean ± SD from at least three independent experiments. Statistical significance is indicated as # p < 0.001 compared to the untreated control group and *** p < 0.001 compared to the α-MSH-treated group.
Figure 7
Figure 7
Effect of rifampicin on CREB and PKA protein expression in α-MSH-stimulated B16F10 cells. Western blot analysis was performed to assess the expression levels of CREB and PKA proteins after 24 h of treatment with rifampicin. The results are presented in three panels: (ac). (a) shows the Western blot results for CREB and PKA proteins with β-actin used as the loading control to ensure equal protein loading. (b) quantifies the relative expression of CREB normalized to β-actin, which is expressed as a percentage of the untreated control group. (c) presents the normalized expression of PKA relative to β-actin. For all panels, α-MSH (100 nM) was used as a negative control, and arbutin (300 μM) served as a positive control. Protein band intensities were quantified using ImageJ software, normalized to the corresponding loading controls, and expressed as the mean ± SD from at least three independent experiments. Statistical significance is indicated as # p < 0.001 compared to the untreated control group and *** p < 0.001 compared to the α-MSH-treated group.
Figure 8
Figure 8
The effects of rifampicin on melanin content and tyrosinase activity in α-MSH-stimulated HEMn-MP cells. (a) For melanin content, rifampicin significantly inhibited α-MSH-induced melanin synthesis in a dose-dependent manner at concentrations of 10, 20, and 40 μM. α-MSH (200 nM) was used as the negative control to induce melanin production, while arbutin (300 μM), a commercially available tyrosinase inhibitor, served as the positive control. (b) For tyrosinase activity, rifampicin demonstrated a significant inhibitory effect on tyrosinase activity in α-MSH-stimulated cells with the highest inhibition observed at 40 μM. The results are presented as the mean ± standard deviation (SD) of three independent experiments, and statistical significance was evaluated using one-way ANOVA. # p < 0.001 indicates a comparison with the untreated control group, while ** p < 0.01 and *** p < 0.001 indicate comparisons with the α-MSH-alone group.

References

    1. Mishra A.S., Vasanthan M., Malliappan S.P. Drug repurposing: A leading strategy for new threats and targets. ACS Pharmacol. Transl. Sci. 2024;7:915–932. doi: 10.1021/acsptsci.3c00361. - DOI - PMC - PubMed
    1. Jonker A.H., O’Connor D., Cavaller-Bellaubi M., Fetro C., Gogou M., ’t Hoen P.A.C., de Kort M., Stone H., Valentine N., Pasmooij A.M.G. Drug repurposing for rare: Progress and opportunities for the rare disease community. Front. Med. 2024;11:1352803. doi: 10.3389/fmed.2024.1352803. - DOI - PMC - PubMed
    1. Pinzi L., Bisi N., Rastelli G. How drug repurposing can advance drug discovery: Challenges and opportunities. Front. Drug Discov. 2024;4:1460100. doi: 10.3389/fddsv.2024.1460100. - DOI
    1. Choudhury C., Arul Murugan N., Priyakumar U.D. Structure-based drug repurposing: Traditional and advanced AI/ML-aided methods. Drug Discov. Today. 2022;27:1847–1861. doi: 10.1016/j.drudis.2022.03.006. - DOI - PMC - PubMed
    1. Schein C.H. Repurposing approved drugs on the pathway to novel therapies. Med. Res. Rev. 2020;40:586–605. doi: 10.1002/med.21627. - DOI - PMC - PubMed

MeSH terms

LinkOut - more resources