

Identification of the Cellular Tipping Point in the Inflammation Model of LPS-Induced RAW264.7 Macrophages Through Raman Spectroscopy and the Dynamical Network Biomarker Theory
- PMID: 40005229
- PMCID: PMC11858581
- DOI: 10.3390/molecules30040920
Identification of the Cellular Tipping Point in the Inflammation Model of LPS-Induced RAW264.7 Macrophages Through Raman Spectroscopy and the Dynamical Network Biomarker Theory
Abstract
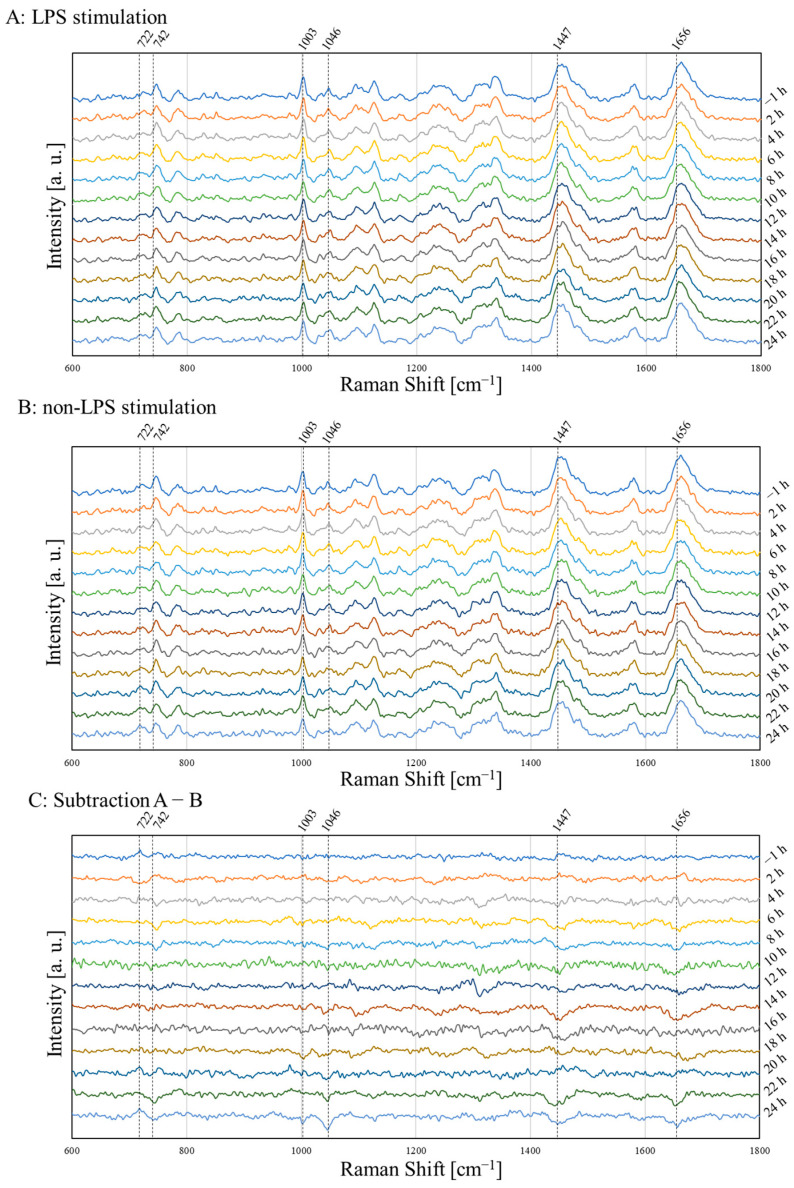
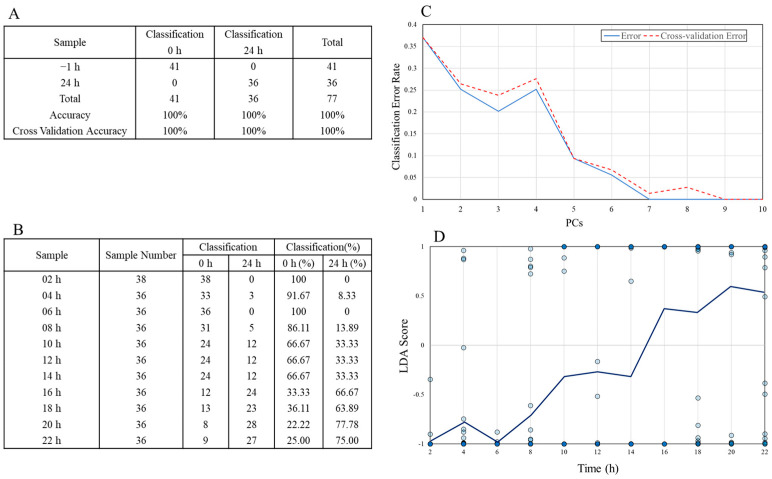
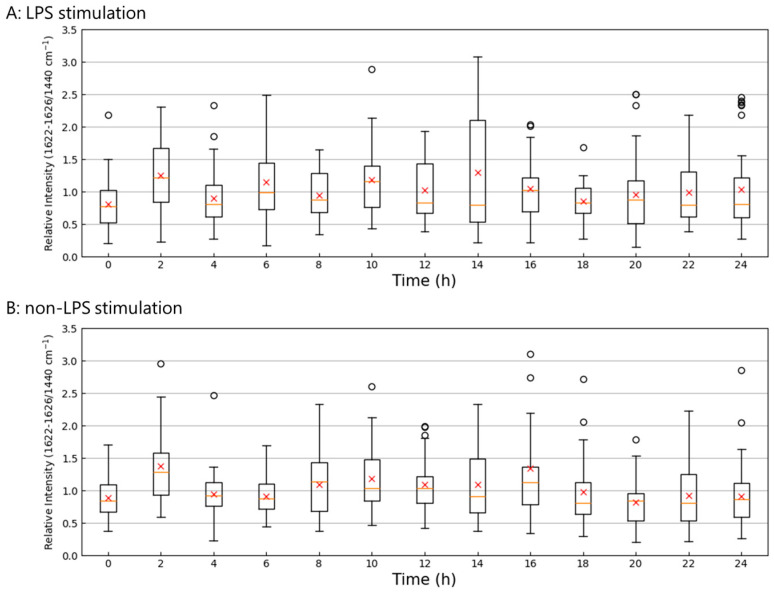
Raman spectroscopy is a non-destructive spectroscopic technique that provides complex molecular information. It is used to examine the physiological and pathological responses of living cells, such as differentiation, malignancy, and inflammation. The responses of two cellular states, initial and full-blown inflammation, have mainly been investigated using a comparative analysis with Raman spectra. However, the tipping point of the inflammatory state transition remains unclear. Therefore, the present study attempted to identify the tipping point of inflammation using a cell model. We stimulated RAW264.7 mouse macrophages with lipopolysaccharide (LPS) and continuously collected Raman spectra every 2 h for 24 h from the initial and full-blown inflammation states. A Partial Least Squares analysis and Principal Component Analysis-Linear Discriminant Analysis predicted the tipping point as 14 h after the LPS stimulation. In addition, a Dynamical Network Biomarker (DNB) analysis, identifying the tipping point of a state transition in various phenomena, indicated that the tipping point was 14 h and identified tryptophan as a biomarker. The results of a multivariate analysis and DNB analysis show the cellular tipping point.
Keywords: DNB theory; Raman spectroscopy; inflammation model; tipping point; tryptophan.
Conflict of interest statement
The authors declare no conflict of interest.
Figures


Similar articles
-
Identifying the crucial tipping point in the maturation process of cultured neurons using Raman spectroscopy and a dynamic network biomarker (DNB) analysis.Biochem Biophys Res Commun. 2025 Jan;743:151167. doi: 10.1016/j.bbrc.2024.151167. Epub 2024 Dec 12. Biochem Biophys Res Commun. 2025. PMID: 39681053
-
Application of the Dynamical Network Biomarker Theory to Raman Spectra.Biomolecules. 2022 Nov 22;12(12):1730. doi: 10.3390/biom12121730. Biomolecules. 2022. PMID: 36551158 Free PMC article.
-
Time resolved and label free monitoring of extracellular metabolites by surface enhanced Raman spectroscopy.PLoS One. 2017 Apr 18;12(4):e0175581. doi: 10.1371/journal.pone.0175581. eCollection 2017. PLoS One. 2017. PMID: 28419111 Free PMC article.
-
Detection of lipopolysaccharide induced inflammatory responses in RAW264.7 macrophages using atomic force microscope.Micron. 2014 Oct;65:1-9. doi: 10.1016/j.micron.2014.03.012. Epub 2014 Apr 1. Micron. 2014. PMID: 25041825
-
TPD: a web tool for tipping-point detection based on dynamic network biomarker.Brief Bioinform. 2022 Sep 20;23(5):bbac399. doi: 10.1093/bib/bbac399. Brief Bioinform. 2022. PMID: 36088546
References
-
- Raman C.V., Krishnan K.S. A New Type of Secondary Radiation. Nature. 1928;121:501–502. doi: 10.1038/121501c0. - DOI
-
- Orlando A., Franceschini F., Muscas C., Pidkova S., Bartoli M., Rovere M., Tagliaferro A. A Comprehensive Review on Raman Spectroscopy Applications. Chemosensors. 2021;9:262. doi: 10.3390/chemosensors9090262. - DOI
MeSH terms
Substances
Grants and funding
LinkOut - more resources
Full Text Sources
