. 2025 Feb 2;12(2):117.
doi: 10.3390/vetsci12020117.

Paeoniflorin Inhibits Porcine Circovirus Type 2 Replication by Inhibiting Autophagy and Targeting AKT/mTOR Signaling

Affiliations

Paeoniflorin Inhibits Porcine Circovirus Type 2 Replication by Inhibiting Autophagy and Targeting AKT/mTOR Signaling

Zhengchang Wu et al. Vet Sci. .

Abstract

Porcine circovirus type 2 (PCV2) is an important pathogen that leads to great economic losses to the swine industry. Paeoniflorin (PF), a novel plant extract, has been reported to have antiviral properties. However, the role of paeoniflorin in regulating PCV2 replication remains unclear. Here, we used the CCK8 assay to demonstrate that PF within safe concentrations (0-275 mM) significantly inhibits PCV2 replication in a dose-dependent manner in porcine kidney cells. Subsequently, comparative transcriptome and functional verification revealed that PF probably inherits PCV2 replication via targeting AKT/mTOR signaling. Further experimental data show that the AKT/mTOR signaling pathway is highly relevant to autophagy. Thus, experimental data from Western blot, qPCR, and the indirect immunofluorescence test indicate that PF inhibits PCV2 replication by inhibiting autophagy by targeting the AKT/mTOR signaling pathway. Together, our results provide insight into the mechanism of paeoniflorin in regulating PCV2 replication and offer new ideas for the treatment of PCV2 infection in pigs.

Keywords: AKT/mTOR signaling; autophagy; paeoniflorin; porcine circovirus type 2.


Conflict of interest statement

The authors declare that they have no known competing financial interests or personal relationships that could have appeared to influence the work reported in this paper.

Figures
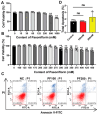
Figure 1
Figure 1
The safety assessment of PF. (A) The gradient dilution method was used to determine the approximate working concentration of PF. (B) The effect of 0–450 mM PF on the activity of PK15 cells was detected through the CCK8 method. (C) The apoptosis levels in cells treated with 100 mM and 200 mM PF were detected by flow cytometry. (D) Statistical analysis of the flow cytometry was performed to detect the apoptosis levels in PK15 cells after PF treatment. All data are presented as the mean ± SD, ns p > 0.05, ** p < 0.01.
Figure 2
Figure 2
The establishment of the PCV2 infection model. (A) PK15 cells were infected with PCV2 for designated lengths of time (0, 12, 24, 48, 72 h), and the relative expression of PCV2 CAP was measured using qPCR. (B) The protein expression of the PCV2 capsid protein in PK15 cells within the specified time periods was analyzed. (C) The results of the fluorescent expression of the PCV2 capsid protein in PK15 cells within the specified time periods are shown. The image scale is 100 μm. All data are presented as the mean ± SD, ** p < 0.01.
Figure 3
Figure 3
The effect of PF on PCV2 replication. (A,B) Different concentrations of PF (0 mM, 5 mM, 15 mM, 25 mM, 50 mM, 100 mM, 200 mM) were used to treat PCV2-infected cells. Subsequently, the DNA expression level of PCV2 CAP was detected by qPCR, and the expression levels of PCV2 CAP were determined by Western blot. (C,D) PCV2-infected cells were treated with different PF addition methods (pre: adding PF 24 h before adding PCV2; co: adding PF simultaneously with adding PCV2; post: adding PF 24 h after adding PCV2). Then, the DNA expression level of PCV2 CAP was detected by qPCR, and the expression levels of PCV2 CAP were detected by Western blot. (E,F) PCV2-infected cells were treated with PF for the indicated times. After that, the DNA expression level of PCV2 CAP was detected by qPCR, and the expression levels of PCV2 CAP were detected by Western blot. (G) The expression of PCV2 CAP on PK15 cells after 48 h of pre-treatment of PF and the protein fluorescence expression on PK15 cells are presented. The scale of the image is 100 μm. All data are presented as the mean ± SD, ns p > 0.05, * p < 0.05, ** p < 0.01.
Figure 4
Figure 4
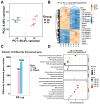
Sequencing results of PF-treated (200 mM) and negative control groups. (A) Principal component analysis plot showing the similarity between sequencing groups. (B) Clustering plot of differential gene grouping, where red indicates the relatively high expression of protein-coding genes and blue indicates the relatively low expression of protein-coding genes. (C) Statistical histogram of differentially expressed genes showing the number of differentially expressed genes that were up-regulated and down-regulated. (D) KEGG bubble map: the bubbles represent the top 20 KEGG pathways enriched in DEGs. The size of the dots indicates the degree of DEG enrichment. The color of the dots indicates the importance of DEG enrichment.
Figure 5
Figure 5
Sequencing results of PF-treated, PCV2-infected, and negative control groups. (A) The four-quadrant plot of differential genes, in which red denotes co-increasing differential genes; blue denotes co-decreasing differential genes; yellow denotes differential genes that rise in PCV2 infection sequencing and fall in PF-treated sequencing; and green denotes differential genes that fall in PCV2 infection sequencing and rise in PF-treated sequencing rising differential genes. (B) KEGG bubble map: the bubbles represent the top 20 KEGG pathways enriched in DEGs. The size of the dots indicates the degree of DEG enrichment. The color of the dots indicates the importance of DEG enrichment.
Figure 6
Figure 6
Effect of PF (200 mM) on the AKT/mTOR pathway and its downstream autophagy (A,B) After treating PK15 cells with PF and RAPA for the indicated durations, the activity of the AKT and mTOR pathways was measured. (C,D) After treating PCV2-infected cells with PF and RAPA for the indicated durations, the activity of the AKT and mTOR pathways was measured. (E) After treating PK15 cells with PF and RAPA for the indicated durations, the levels of LC3 and P62 were detected. (F) After treating PCV2-infected cells with PF and RAPA for the indicated durations, the levels of LC3 and P62 were detected.
Figure 7
Figure 7
After PK15 cells were treated with PF (200 mM) and RAPA for the indicated times, confocal fluorescent images of PK15 cells expressing mRFP-GFP-LC3 were obtained. In the confocal fluorescence image, red LC3 dots represent autophagosomes and autolysosomes, green LC3 dots represent only autophagosomes and blue dots represent the nucleus. The scale of the image is 20 μm.
Figure 8
Figure 8
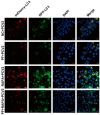
After PCV2-infected cells were treated with PF (200 mM) and RAPA for the indicated times, confocal fluorescent images of PK15 cells expressing mRFP-GFP-LC3 were obtained. In the confocal fluorescence images, red LC3 spots signify autophagosomes and autolysosomes, green LC3 spots indicate only autophagosomes and blue spots represent the nucleus. The scale of the image is 20 μm.
Figure 9
Figure 9
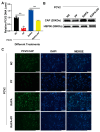
The effect of PF (200 mM) on PCV2 replication through autophagy and a rescue experiment with the autophagy activator RAPA. (A) The copy number of porcine circovirus type 2 (PCV2) in PK15 cells was counted after the treatment with PF and RAPA. (B) The protein expression of the PCV2 capsid protein (CAP) in PK15 cells was examined after PF and RAPA treatment. (C) The results of the fluorescent expression of the PCV2 capsid protein in PK15 cells were obtained after the application of PF and RAPA treatment. All data are presented as the mean ± SD, ** p < 0.01.
Figure 10
Figure 10
Mechanism of PF inhibiting PCV2 replication by influencing autophagy through the AKT/mTOR pathway.

Similar articles

Cited by

References

    1. Opriessnig T., Karuppannan A.K., Castro A.M.M.G., Xiao C.T. Porcine circoviruses: Current status, knowledge gaps and challenges. Virus Res. 2020;286:198044. doi: 10.1016/j.virusres.2020.198044. - DOI - PubMed
    1. Ren L., Chen X., Ouyang H. Interactions of porcine circovirus 2 with its hosts. Virus Genes. 2016;52:437–444. doi: 10.1007/s11262-016-1326-x. - DOI - PubMed
    1. Segalés J. Porcine circovirus type 2 (PCV2) infections: Clinical signs, pathology and laboratory diagnosis. Virus Res. 2012;164:10–19. doi: 10.1016/j.virusres.2011.10.007. - DOI - PubMed
    1. Karuppannan A.K., Opriessnig T. Porcine Circovirus Type 2 (PCV2) Vaccines in the Context of Current Molecular Epidemiology. Viruses. 2017;9:99. doi: 10.3390/v9050099. - DOI - PMC - PubMed
    1. Lv Q.Z., Guo K.K., Zhang Y.M. Current understanding of genomic DNA of porcine circovirus type 2. Virus Genes. 2014;49:1–10. doi: 10.1007/s11262-014-1099-z. - DOI - PubMed

LinkOut - more resources