. 2025 Jan 30;18(2):189.
doi: 10.3390/ph18020189.

Alternaria alternata (Fr) Keissl Crude Extract Inhibits HIV Subtypes and Integrase Drug-Resistant Strains at Different Stages of HIV Replication

Affiliations

Alternaria alternata (Fr) Keissl Crude Extract Inhibits HIV Subtypes and Integrase Drug-Resistant Strains at Different Stages of HIV Replication

Darian Naidu et al. Pharmaceuticals (Basel). .

Abstract

Background/Objectives: The development of HIV drug resistance to current antiretrovirals, and the antiretrovirals' inability to cure HIV, provides the need of developing novel drugs that inhibit HIV-1 subtypes and drug-resistance strains. Fungal endophytes, including Alternaria alternata, stand out for their potentially antiviral secondary metabolites. Hence, this study investigates the anti-HIV activities and mechanism of action of the A. alternata crude extract against different HIV-1 subtypes and integrase-resistant mutant strains. Methods: Cytotoxicity of the A. alternata crude extract on TZM-bl cells using the 3-(4,5-dimethylthiazol-2-yl)-2,5-diphenyl tetrazolium bromide (MTT) assay was performed. The crude extract antiviral activity against subtypes A, B, C, and D and integrase drug-resistant strain T66K and S230R was determined using a luciferase-based antiviral assay. Luciferase and p24 ELISA-based time-of-addition assays were used to determine the mechanism of action of the crude extract. Docking scores and protein ligand interactions of integrase T66K and S230R strains against the identified bioactive compounds were determined. Results: The crude extract CC50 was 300 μg/mL and not cytotoxic to the TZM-bl cell lines. In HIV-1 subtypes A, B, C, and D, the crude extract exhibited 100% inhibition and therapeutic potential. The A. alternata crude extract had strong anti-HIV-1 activity against integrase strand transfer drug-resistant strains T66K and S230R, with a 0.7265- and 0. 8751-fold increase in susceptibility. The crude extract had antiviral activity during attachment, reverse transcription, integration, and proteolysis. In silico calculations showed compounds 2,3-2H-Benzofuran-2-one, 3,3,4,6-tetramethyl-, 3-Methyl-1,4-diazabicyclo[4.3.0]nonan-2,5-dione, N-acetyl, Coumarin, 3,4-dihydro-4,5,7-trimethyl-, Cyclopropanecarboxamide, N-cycloheptyl, Pyrrolo[1,2-a]pyrazine-1,4-dione, and hexahydro-3-(2-methylpropyl)- crude extract bioactive compounds had strong docking scores and diverse binding mechanisms with integrase. Conclusions: The A. alternata crude extract demonstrates strong antiviral activity against different HIV-1 subtypes and integrase drug-resistance strains. The extract inhibited various stages of the HIV-1 life cycle. The bioactive compounds 2,3-2H-Benzofuran-2-one, 3,3,4,6-tetramethyl-, 3-Methyl-1,4-diazabicyclo[4.3.0]nonan-2,5-dione, N-acetyl, Coumarin, 3,4-dihydro-4,5,7-trimethyl-, Cyclopropanecarboxamide, N-cycloheptyl, Pyrrolo[1,2-a]pyrazine-1,4-dione, and hexahydro-3-(2-methylpropyl)- may be responsible for the antiviral activity of A. alternata.

Keywords: A. alternata; HIV-subtypes; anti-HIV activity; integrase inhibitors; molecular docking.


Conflict of interest statement

The authors declare no conflicts of interest.

Figures

Figure 1
Figure 1
Cell viability (A) and cell cytotoxicity (B) of the A. alternata crude extract were determined by MTT assay. The cell viability (A) y-axis represents the percentage cell viability of the TZM-bl cells and the x-axis represents the treatments crude extract, azidothymidine, and 0.2% DMSO. The TZM-bl cells treated dose-response curves (B) showing the percentage cell cytotoxicity were used to determine the CC50 of the A. alternata crude extract blue line (CC50 = 300 ± 1.83 µg/mL) and azidothymidine red line (CC50 = 385 ± 6.29 µg/mL). The y-axis of the dose-response curves shows the percentage of cell cytotoxicity and the x-axis shows the log concentration of the A. alternata crude and azidothymidine. The MTT assay was completed in triplicate.
Figure 2
Figure 2
Dose-dependent curves showing antiviral activity of A. alternata crude extract against MC 2297 (A), pNL4.3 (B) CM9 (C), and PC 60 (D) HIV-1 viruses belonging to respective subtypes A, B, C, and D. The y-axis of (AD) shows the inhibition of HIV as a percentage. The x-axis (AD) shows the log concentration of the crude extract or azidothymidine. The red line shows the positive control azidothymidine and the blue line shows the A. alternata crude extract. The luciferase-based antiviral assay was completed in triplicate.
Figure 3
Figure 3
The fold change in IC50 of viruses PC 148, MC 2297, pNL4.3, YU2, CM7, CM9, PC 60, and PC 178 treated with the A. alternata crude extract relative to pNL4.3. The y-axis represents the fold change in IC50 relative to pNL4.3. The x-axis represents the virus treated with the A. alternata crude extract. The blue bars indicate that A. alternata crude extract was the treatment used. The luciferase-based antiviral assay was completed in triplicate.
Figure 4
Figure 4
The infectivity of different subtype HIV-1 viruses PC 148, MC 2297, YU2, CM7, CM9, PC 60, and PC 178 (A) T66K, E92Q, S230R, and R263K (B) integrase drug-resistant mutants relative to control wild-type virus pNL4.3. The y-axis represents the infectivity of (A,B) viruses in relative light units (RLUs). The x-axis of (A,B) represents the virus being tested.
Figure 5
Figure 5
Dose-response curves of A. alternata crude extract integrase drug-resistant strains T66K and S230R. The y-axis of (AF) shows the inhibition of HIV as a percentage. The x-axis (AF) shows the log concentration of the A. alternata crude extract, raltegravir, or dolutegravir. The red lines (A,D), (B,E), and (C,F) show raltergravir (WT), dolutergravir (WT), and A. alternata crude extract (WT), respectively. The blue lines (AC) and (DF) show raltergravir (T66K), dolutergravir (T66K), A. alternata crude extract (T66K), raltergravir (S230R), dolutergravir (S230R), and A. alternata crude extract (S230R), respectively. The luciferase-based antiviral assay was completed in triplicate.
Figure 6
Figure 6
The overall inhibition of the subtype A, B, C, and D viruses treated with A. alternata crude extract during different stages in the HIV life cycle (A). For (A), the y-axis represents the inhibition as a percentage and the x-axis represents the stage of the HIV life cycle. The pink, green, purple, and orange squares represent attachment, reverse transcription, integration, and proteolysis, respectively. The red text represents the percentage inhibition of the drug controls maraviroc, azidothymidine, raltegravir, and amprenavir, respectively. The white text represents the percentage inhibition of A. alternata crude extract. Luciferase-based time of addition of viruses MC2297 (B), pNL4.3 (C), CM9 (D), and PC60 (E). The y-axis of (BE) shows the inhibition of HIV as a percentage. The x-axis of (BE) shows the time of addition in hours. For (BE), the pink, green, purple, orange, and blue lines of (BE) represent maraviroc, azidothymidine, raltegravir, amprenavir, and A. alternata crude extract, respectively. The A. alternata crude extract was added at 1, 3, 5, 6, 8, 10, 16, and 20 h post-infection. The luciferase-based time-of-addition assay was done in duplicate.
Figure 7
Figure 7
The overall inhibition of the integrase drug-resistant viruses treated with A. alternata crude extract during different stages in the HIV life cycle (A). For (A), the y-axis represents the inhibition as a percentage and the x-axis represents the stage of the HIV life cycle. The pink, green, purple, and orange squares represent attachment, reverse transcription, integration, and proteolysis, respectively. The red text represents the percentage inhibition of the drug controls maraviroc, azidothymidine, raltegravir, and amprenavir, respectively. The white text represents the percentage inhibition of A. alternata crude extract. Luciferase-based time of addition of integrase drug-resistant viruses T66K (B) and S230R (C). The y-axis of (B,C) shows the inhibition of HIV as a percentage. The x-axis of (B,C) shows the time of drug addition in hours. For (B,C), the pink, green, purple, orange, and blue lines of (B,C) represent maraviroc, azidothymidine, raltegravir, amprenavir, and A. alternata crude extract, respectively. The A. alternata crude extract was added at 1, 3, 5, 6, 8, 10, 16, and 20 h post-infection. The luciferase-based time-of-addition assay was done in duplicate.
Figure 8
Figure 8
The overall HIV p24 titre (pg/mL) of the CM9, M2297, T66K, and S230R viruses treated with A. alternata crude extract during different stages in the HIV life cycle (A). The pink, green, purple, orange, and blue lines of (BE) represent maraviroc, azidothymidine, raltegravir, amprenavir, and A. alternata crude extract, respectively. For (A), the y-axis represents the inhibition as a percentage and the x-axis represents the stage of the HIV life cycle. The pink, green, purple, and orange squares represent attachment, reverse transcription, integration, and proteolysis, respectively. The red text represents the percentage inhibition of the drug controls maraviroc, azidothymidine, raltegravir, and amprenavir, respectively. The white text represents the percentage inhibition of the A. alternata crude extract. p24-based time of addition of viruses CM9 (B), M2297 (C), T66K (D), and S230R (E). The y-axis of (BE) shows the concentration of HIV p24 in pg/mL. The x-axis of (BE) shows the time of addition in hours. The A. alternata crude extract was added at 0, 1, 3, 8, 10, 14, 24, and 30 h post-infection. The pink, green, purple, and orange squares represent attachment, reverse transcription, integration, and proteolysis, respectively. The HIV-1 p24 time-based ELISA was completed once due to budget constraints. Therefore, a luciferase-based time-of-addition assay was done with the HIV-1 p24 time-based ELISA.
Figure 9
Figure 9
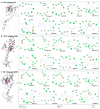
Three-dimensional (3D) docking pose of compound 1 (cyan), compound 3 (yellow), compound 6 (orange), compound 7 (blue), compound 13 (brown), raltegravir (magenta), dolutegravir (medium purple), bictegravir (forest green), and cabotegravir (brown) with HIV-1 integrase wild type (light grey) (A), T66K strain (grey) (B), S230R strain (dark grey) (C), and their respective two-dimensional (2D) protein–ligand interaction framework. Bond types are shown, and the topologies of T66K and S230R mutations are coloured red.

Similar articles

Cited by

References

    1. UNAIDS R. Global AIDS report. Geneva Switzerland. 2024. [(accessed on 21 August 2024)]. Available online: www.unaids.org/en/resources/documents/2024/global-aids-update-2024.
    1. Maeda K., Das D., Kobayakawa T., Tamamura H., Takeuchi H. Discovery and Development of Anti-HIV Therapeutic Agents: Progress Towards Improved HIV Medication. Curr. Top. Med. Chem. 2019;19:1621–1649. doi: 10.2174/1568026619666190712204603. - DOI - PMC - PubMed
    1. Phanuphak N., Gulick R.M. HIV treatment and prevention 2019: Current standards of care. Curr. Opin. HIV AIDS. 2020;15:4–12. doi: 10.1097/COH.0000000000000588. - DOI - PubMed
    1. Patiño-Galindo J.Á., González-Candelas F. The substitution rate of HIV-1 subtypes: A genomic approach. Virus Evol. 2017;3:vex029. doi: 10.1093/ve/vex029. - DOI - PMC - PubMed
    1. Langs-Barlow A., Paintsil E. Impact of human immunodeficiency virus type-1 sequence diversity on antiretroviral therapy outcomes. Viruses. 2014;6:3855–3872. doi: 10.3390/v6103855. - DOI - PMC - PubMed

LinkOut - more resources