. 2025 Feb 4;17(2):189.
doi: 10.3390/pharmaceutics17020189.

LB-100 Enhances Drugs Efficacy Through Inhibition of P-Glycoprotein Expression in Multidrug-Resistant Glioblastoma and Non-Small Cell Lung Carcinoma Cellular Models

Affiliations

LB-100 Enhances Drugs Efficacy Through Inhibition of P-Glycoprotein Expression in Multidrug-Resistant Glioblastoma and Non-Small Cell Lung Carcinoma Cellular Models

Ana Podolski-Renić et al. Pharmaceutics. .

Abstract

Background/Objectives: This study explores the potential of LB-100 (a protein phosphatase 2A-PP2A inhibitor) combined with adavosertib (a WEE1 kinase inhibitor) and doxorubicin (DOX), to overcome multidrug resistance (MDR) in cancer cells and enhance treatment efficacy. Methods: We evaluated LB-100 combinations with adavosertib and DOX in patient-derived glioblastoma and non-small cell lung carcinoma cells (NSCLCs) using a real-time cell analyzer. Effectiveness was also assessed through immunofluorescence assay, and interactions were analyzed via SynergyFinder+. We also examined P-glycoprotein (P-gp) expression and drug resistance genes' expression in MDR glioblastoma and NSCLCs after LB-100 treatment, as well as LB-100 sensitizing effect on DOX and DOX accumulation. Results: LB-100 significantly boosts the effectiveness of adavosertib and DOX after multiple applications. It also enhances these drugs' cytotoxicity in a single application without acting synergistically. Additionally, LB-100 reduces P-gp expression in MDR glioblastoma and NSCLCs, sensitizing them to DOX and increasing its accumulation. Conclusions: LB-100 enhances the effectiveness of drugs against MDR cancer cells, presenting a promising strategy to overcome drug resistance in glioblastoma and NSCLCs through P-gp modulation.

Keywords: LB-100; P-glycoprotein; adavosertib; doxorubicin; glioblastoma; multidrug resistance; non-small cell lung carcinoma; protein phosphatase 2A.


Conflict of interest statement

The authors declare no conflicts of interest.

Figures

Figure 1
Figure 1
Cell proliferation rates monitored over time using the xCELLigence system. DT7 glioblastoma cells (a) were observed for 235 h, while TR159 NSCLCs (b) were monitored for 357 h. The results were obtained by treating patient-derived DT7 cells and TR159 cells with LB-100 at concentrations of 2.5 µM and 5.0 µM, as well as adavosertib (ADAVO) and doxorubicin (DOX) at concentrations of 250 nM and 500 nM. The treatments also included combinations of LB-100 with ADAVO and LB-100 with DOX. The Cell Index (CI) of the control cells (on the y-axis) was compared to the CI of the drug-treated cells and their combinations. The results were analyzed using the RTCA software for single plate (SP) analyses.
Figure 2
Figure 2
The expression of the P-gp in DT7 glioblastoma cells (a) and TR159 NSCLCs (b), evaluated following treatments with LB-100, adavosertib and doxorubicin (DOX), and a combination of 1 µM LB-100 with adavosertib and DOX. Assessments were performed using the ImageXpress PICO and corresponding software, CellReporterXpress version 2.8.2.669 (Molecular Devices). The graphs were generated in GraphPad Prism 8.0.2 and show the percentage of cells that tested positive for the P-gp antibody. Patient-derived cells were classified as inherently resistant if at least 20% of the cells were positive for the P-gp transporter. Data are presented as mean ± SEM with n = 4. Statistical significance compared to untreated control cells is as follows: * p < 0.05; ** p < 0.01; *** p < 0.001. The statistical significance of combined treatments compared to corresponding single treatments with adavosertib or DOX is indicated as ### p < 0.001.
Figure 3
Figure 3
The time- and dose-dependent effects of LB-100 on P-gp expression in multidrug-resistant U87-TxR glioblastoma cells (a) and NCI-H460/R NSCLCs (b). The corresponding sensitive cells, U87 and NCI-H460, were used as reference controls for P-gp expression in the multidrug-resistant cells. Flow cytometry profiles representing results obtained after 72 h were generated using the CytoFLEX flow cytometer and the CytExpert software (Beckman Coulter, Indianapolis, IN, USA). The graphs were created in GraphPad Prism 8.0.2 software. Each sample included at least 10,000 events. The data are presented as mean ± SEM, with statistical significance indicated compared to the untreated control U87-TxR and NCI-H460/R cells: *** p < 0.001.
Figure 4
Figure 4
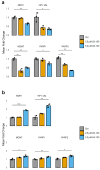
Relative mRNA expression levels of drug resistance-related genes (MDR1, HIF-1α, MGMT, PARP1 and PARP2) analyzed following a 24 h treatment with LB-100 in U87-TxR (a) and NCI-H460/R (b) cells. ACTB was used for normalization (n = 3). The graphs and figures were generated in R—statistical software with the ggplot2 package (Version 3.5.1). The data are presented as mean ± SEM with n = 3. Statistical significance compared to untreated control cells is as follows: * p < 0.05; ** p < 0.01; *** p < 0.001.
Figure 5
Figure 5
Reversal of doxorubicin (DOX) resistance by LB-100 in simultaneous and subsequent treatment schedules in U87-TxR glioblastoma (a) and NCI-H460/R NSCLC (b) cells. The cell growth was compared between DOX administered alone and in combination with LB-100. Both treatment schedules lasted for 72 h. In the subsequent treatment schedule, DOX was applied for 48 h, following the administration of LB-100 24 h earlier. The results were assessed by MTT, while the graphs were created in GraphPad Prism 8.0.2.
Figure 6
Figure 6
Doxorubicin (DOX) accumulation study after LB-100 treatment in U87-TxR glioblastoma (a) and NCI-H460/R NSCLCs (b). Flow cytometry profiles were generated using the CytoFLEX flow cytometer and the CytExpert software (Beckman Coulter, Indianapolis, IN, USA). The graphs were created in GraphPad Prism 8.0.2 software. Each sample included at least 10,000 events. The data are presented as mean ± SEM, with statistical significance indicated compared to untreated control U87-TxR and NCI-H460/R cells: *** p < 0.001.

Similar articles

References

    1. Wang H., Zhang Y., Zhang H., Cao H., Mao J., Chen X., Wang L., Zhang N., Luo P., Xue J., et al. Liquid biopsy for human cancer: Cancer screening, monitoring, and treatment. MedComm. 2024;5:e564. doi: 10.1002/mco2.564. - DOI - PMC - PubMed
    1. Hanahan D., Weinberg R.A. Hallmarks of cancer: The next generation. Cell. 2011;144:646–674. doi: 10.1016/j.cell.2011.02.013. - DOI - PubMed
    1. Falzone L., Salomone S., Libra M. Evolution of Cancer Pharmacological Treatments at the Turn of the Third Millennium. Front. Pharmacol. 2018;9:1300. doi: 10.3389/fphar.2018.01300. - DOI - PMC - PubMed
    1. Gillies R.J., Verduzco D., Gatenby R.A. Evolutionary dynamics of carcinogenesis and why targeted therapy does not work. Nat. Rev. Cancer. 2012;12:487–493. doi: 10.1038/nrc3298. - DOI - PMC - PubMed
    1. Pagliarini R., Shao W., Sellers W.R. Oncogene addiction: Pathways of therapeutic response, resistance, and road maps toward a cure. EMBO Rep. 2015;16:280–296. doi: 10.15252/embr.201439949. - DOI - PMC - PubMed

LinkOut - more resources