. 2025 Jan 29;17(2):190.
doi: 10.3390/v17020190.

DNA-Binding Activities of KSHV DNA Polymerase Processivity Factor (PF-8) Complexes

Affiliations

DNA-Binding Activities of KSHV DNA Polymerase Processivity Factor (PF-8) Complexes

Jennifer Kneas Travis et al. Viruses. .

Abstract

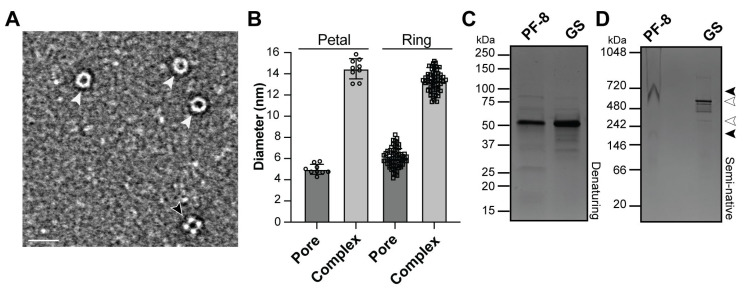
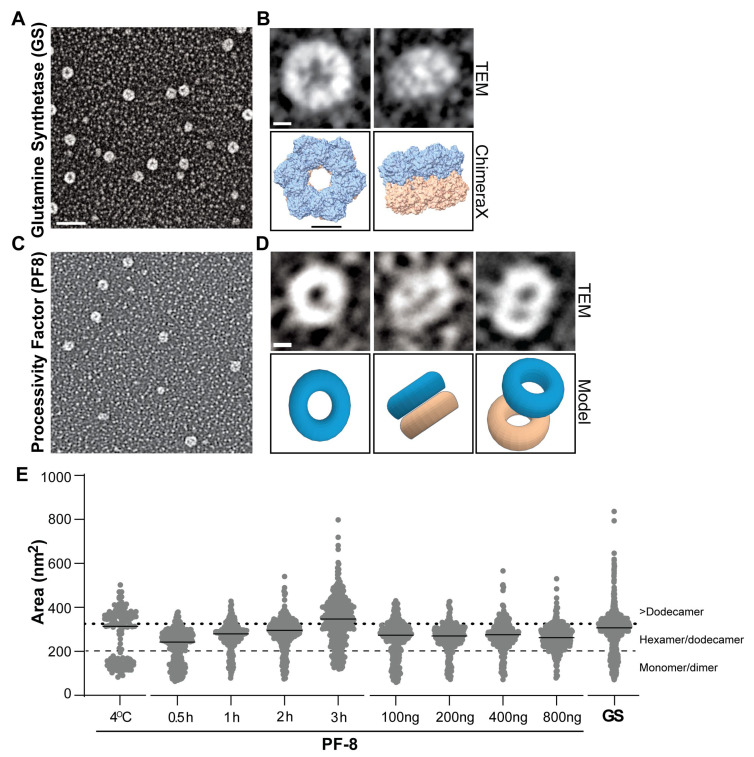
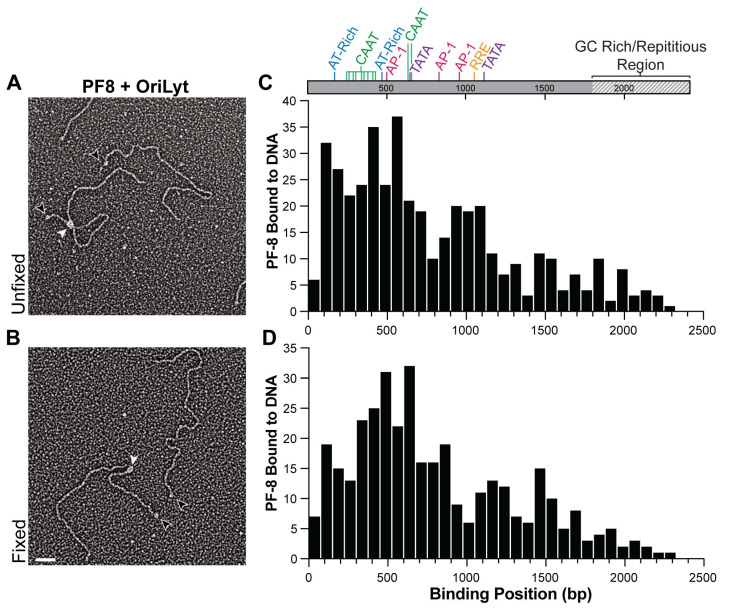
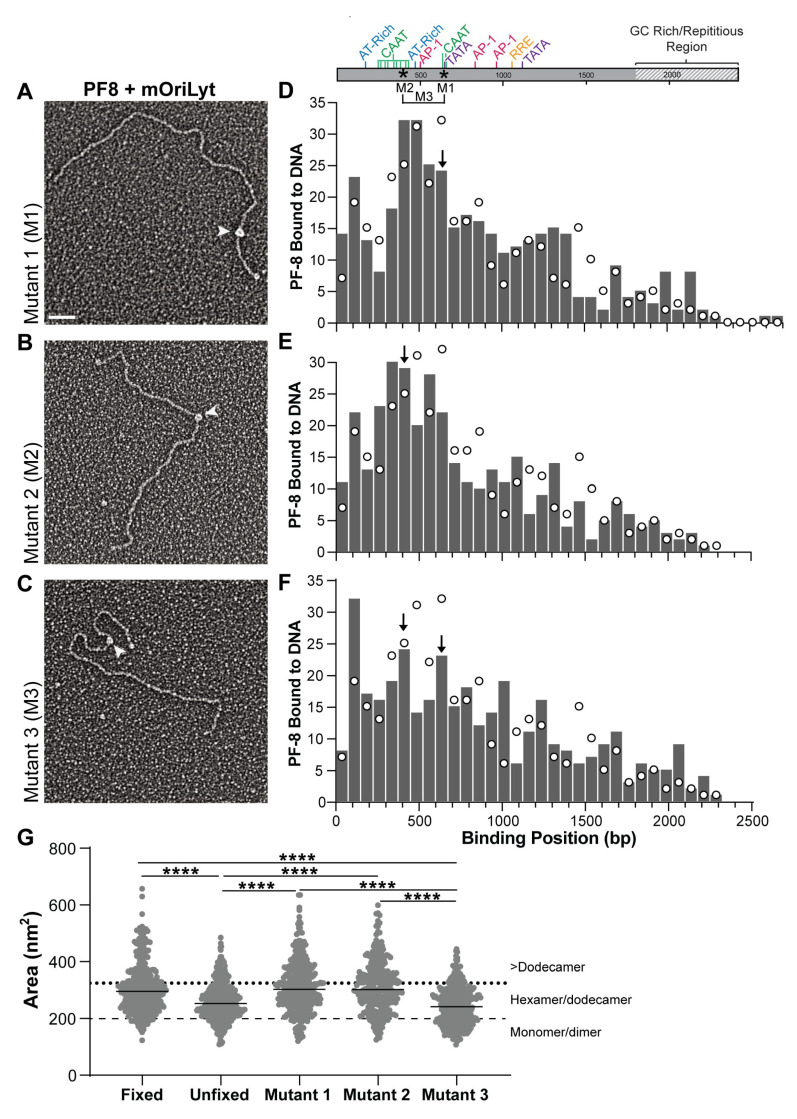
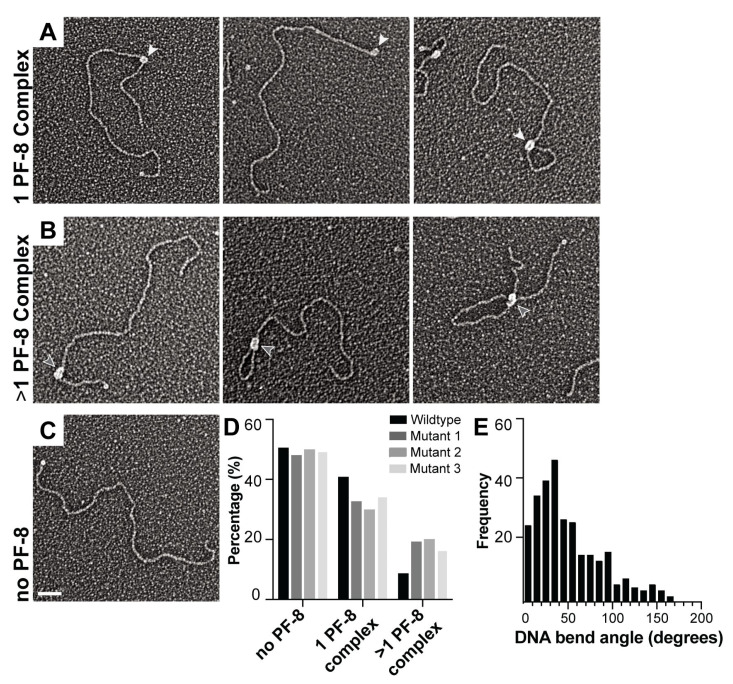
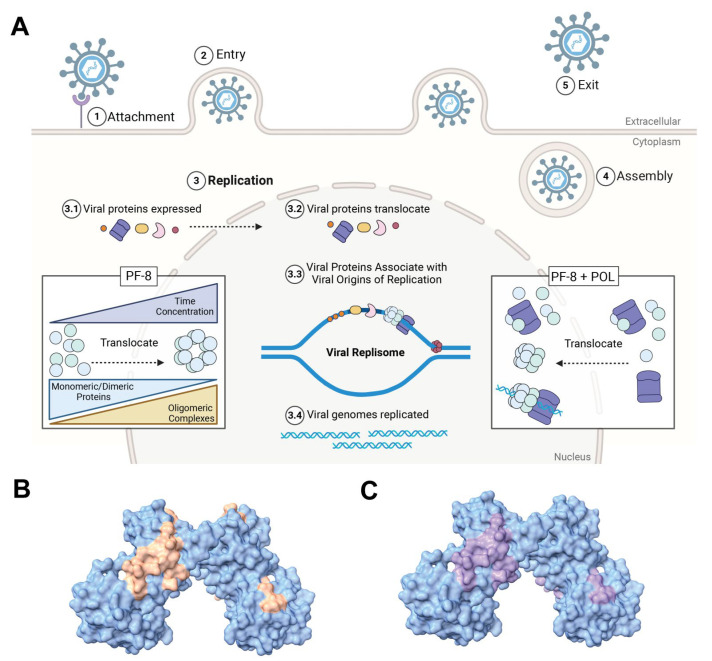
Kaposi's Sarcoma Herpesvirus (KSHV) is the causative agent of several human diseases. There are few effective treatments available to treat infection and KSHV oncogenesis. Disrupting the KSHV infectious cycle would diminish the viral spread. The KSHV lytic phase and production of new virions require efficient copying and packaging of the KSHV genome. KSHV encodes its own lytic DNA replication machinery, including the processivity factor (PF-8), which presents itself as an attractive target for antiviral development. We characterized PF-8 at the single molecule level using transmission electron microscopy to identify key molecular interactions that mediate viral DNA replication initiation. Our results indicate that PF-8 forms oligomeric ring structures (tetramer, hexamer, and/or dodecamer) similar to the related Epstein-Barr virus processivity factor (BMRF1). Our DNA positional mapping revealed high-frequency binding locations of PF-8 within the lytic origin of replication (OriLyt). A multi-variable analysis of PF-8 DNA-binding activity with three mutant OriLyts provides new insights into the mechanisms that PF-8 associates with viral DNA and complexes to form multi-ring-like structures. Collectively, these data enhance the mechanistic understanding of the molecular interactions (protein-protein and protein-DNA) of an essential KSHV DNA replication protein.

Keywords: HHV-8; KSHV; electron microscopy; human herpesviruses; viral replication.


Conflict of interest statement

The authors declare no conflicts of interest.

Figures

Figure 1
Figure 1
Detection of higher molecular weight PF-8 oligomers: (A). Representative electron micrograph of PF-8 using negative staining revealed two distinct conformations. White arrowheads denote ring conformation and black arrowhead denote a petal conformation. Scale bar = 25 nm (B). Quantification of the diameter of the central pore and complex of the petal and ring conformations was carried out by manually measuring. Petal pore: 5.00 ± 0.47 nm, petal complex: 14.48 ± 0.95 nm (n = 9), ring pore: 6.07 ± 0.89 nm, ring complex: 13.29 ± 0.96 nm (n = 64). (C). Denaturing gel of PF-8 (52 kDa) and GS (51.9 kDa). (D). Semi-native gel of PF-8 (filled arrowheads) and GS (open arrowheads). PF-8 forms a possible dodecamer (52 kDa × 12 = 624 kDa) and tetramer (52 kDa × 4 = 208 kDa). GS possibly forms dodecamer (622.8 kDa) and hexamer (311.4 kDa).
Figure 2
Figure 2
Single-molecule EM analysis of GS and PF-8 areas: (A). Representative electron micrograph of GS with tungsten rotary shadowing. Scale bar = 50 nm. (B). Single-molecule comparison of individual molecules of GS observed with matched known structures (PDB: 8PVG). Scale bar = 5 nm. (C). Representative electron micrograph of PF-8 with tungsten rotary shadowing. (D). Single-molecule analysis of PF-8 with a proposed model representation of the observed structures. Scale bar = 5 nm (E). Dot plots of the area of PF-8 over a range of conditions: 4 °C, 0.5−3 h (200 ng at room temperature), 100−800 ng (1 h incubation at room temperature), and GS. The median values are shown for each condition by the horizontal line. Dotted and dashed lines represent cutoffs for the different PF-8 oligomers: monomer/dimer, hexamer/dodecamer, and >dodecamer.
Figure 3
Figure 3
Mapping PF-8 DNA binding locations within KSHV lytic origin DNA. Representative electron micrographs of PF-8 in the (A). absence (unfixed) and (B). presence (fixed) of glutaraldehyde. White arrowheads denote PF-8 and black arrowheads denote streptavidin. Scale bar = 50 nm (C). Positional analysis of PF-8 binding to the OriLyt under unfixed condition (n = 427). (D). Positional analysis of PF-8 under binding to OriLyt under fixed conditions (n = 361). Aligned with the histograms is the annotated sequence of the OriLyt. Known sequences that correspond to the x-axis and binding position (bp) are highlighted. Histogram bin sizes are set to 75 bp.
Figure 4
Figure 4
Modulating PF-8 DNA binding locations with nucleotide substitutions within OriLyt. Representative electron micrograph of PF-8 bound to (A). mutant 1 (M1), (B). mutant 2 (M2), or (C). mutant 3 (M3) OriLyt DNA under fixed conditions. Arrowheads denote PF-8. Scale bar = 50 nm. The DNA positional histograms of PF-8 bound to (D). mutant 1 (M1), (E). mutant 2 (M2), or (F). mutant 3 (M3) OriLyt DNA. Arrows denote the peak that contains the mutated nucleotides. Aligned with the histograms is the annotated sequence of the OriLyt with known sequences and locations of mutations. Open circles correlate with the frequency heights for the wild-type OriLyt histogram shown in Figure 3C. (G). Dot plot of the areas of PF-8 bound to the different OriLyt DNAs. The median values are shown for each condition by the horizontal line. Dotted and dashed lines represent cutoffs for the different PF-8 oligomers: monomer/dimer, hexamer/dodecamer, and >dodecamer. Kruskal–Wallis with Dunn’s multiple comparison test was used to determine statistical significance for protein area, **** indicates p-value < 0.0001.
Figure 5
Figure 5
Characterizing OriLyt DNA structures and PF-8 complexes. Representative electron micrographs of OriLyt DNA and PF-8: (A). Single PF-8 complexes with linear and looped OriLyt. (B). Multiple PF-8 complexes with linear and looped OriLyt. (C). OriLyt DNA labeled with streptavidin and no PF-8 associated. White arrowheads denote one PF-8 complex and gray arrowheads denote two PF-8 complexes. Scale bar = 50 nm. (D). Quantification of DNA that contains no PF-8 bound, one complex of PF-8 bound, or two complexes of PF-8 bound with the wild-type, mutant 1, mutant 2, and mutant 3 DNAs under fixed conditions. The percentage of DNA molecules was calculated by dividing the number of molecules observed in each category by the total number of DNA molecules quantified and multiplying by 100. (E). Histogram of the PF-8 induced DNA bend angles.
Figure 6
Figure 6
Differential analysis of PF-8 complex area and DNA binding location(s): Heat maps depict the number of PF-8 protein complexes and protein area compared to PF-8 DNA binding locations under (A). unfixed or fixed conditions with OriLyt, and fixed conditions with (B). mutant 1 (M1), (C). mutant 2 (M2), and (D). mutant 3 (M3). The protein area measurements were subdivided into three different categories: greater than a dodecamer has an area >325 nm2, dodecamer/hexamer has an area between 200 and 325 nm2, and a monomer/dimer area <200 nm2 left y-axis. The mutations are indicated by arrows above the heat map. (E). Pie charts display the proportion of the different oligomeric states of PF-8 under different conditions and with different DNAs. (F). Schematic depicting the relationship between PF-8 area (shifts between 3 categories) and DNA binding location (DNA binding region) to wild-type and mutant OriLyt DNA (M1-3). The grey directionality of arrows within the graph indicates changes in binding location and shifts in protein area. Black circles denote hexamer/dodecamer PF-8 highest frequency binding location to wild-type OriLyt, and grey circles represent PF-8 highest frequency binding location to mutant OriLyt (M1-3). The black arrows above the graph indicate mutation locations.
Figure 7
Figure 7
Models of PF-8’s structures, function, and localization during KSHV lytic replication. (A). During KSHV lytic DNA replication, PF-8 is translated into the cytoplasm and subsequently translocated into the nucleus. The effective concentration of PF-8 in the nucleus increases the propensity of PF-8 to form ring complexes. PF-8 is required for KSHV DNA polymerase (POL) translocation into the nucleus. Once KSHV DNA replication proteins are localized within the nucleus, the viral replisome assembles to initiate viral replication. Light green and blue circles indicate PF-8 and purple protein denotes POL. Crystal structure [3HSL] of PF-8 dimers depicting (B). identified dimerization domains (orange) and (C). DNA polymerase binding domain (purple).

Similar articles

References

    1. Cohan B., Frappier L. Herpesvirus DNA Polymerase Processivity Factors: Not Just for DNA Synthesis. Virus Res. 2021;298:198394. doi: 10.1016/j.virusres.2021.198394. - DOI - PubMed
    1. Van Lint A.L., Knipe D.M. Herpesviruses. Encycl. Microbiol. 2019:565–579. doi: 10.1016/B978-0-12-801238-3.02509-5. - DOI
    1. Li S., Bai L., Dong J., Sun R., Lan K. Kaposi’s Sarcoma-Associated Herpesvirus: Epidemiology and Molecular Biology. In: Cai Q., Yuan Z., Lan K., editors. Infectious Agents Associated Cancers: Epidemiology and Molecular Biology Advances in Experimental Medicine and Biology. Vol. 1018. Springer; Singapore: 2017. pp. 91–127. - DOI - PubMed
    1. Naimo E., Zischke J., Schulz T.F. Recent Advances in Developing Treatments of Kaposi’s Sarcoma Herpesvirus-Related Diseases. Viruses. 2021;13:1797. doi: 10.3390/v13091797. - DOI - PMC - PubMed
    1. Polizzotto M.N., Uldrick T.S., Hu D., Yarchoan R. Clinical Manifestations of Kaposi Sarcoma Herpesvirus Lytic Activation: Multicentric Castleman Disease (KSHV-MCD) and the KSHV Inflammatory Cytokine Syndrome. Front. Microbiol. 2012;3:73. doi: 10.3389/fmicb.2012.00073. - DOI - PMC - PubMed

Publication types

MeSH terms

LinkOut - more resources