

Influence of Viral Re-Infection on Head Kidney Transcriptome of Nervous Necrosis Virus-Resistant and -Susceptible European Sea Bass (Dicentrarchus labrax, L.)
- PMID: 40006985
- PMCID: PMC11860166
- DOI: 10.3390/v17020230
Influence of Viral Re-Infection on Head Kidney Transcriptome of Nervous Necrosis Virus-Resistant and -Susceptible European Sea Bass (Dicentrarchus labrax, L.)
Abstract
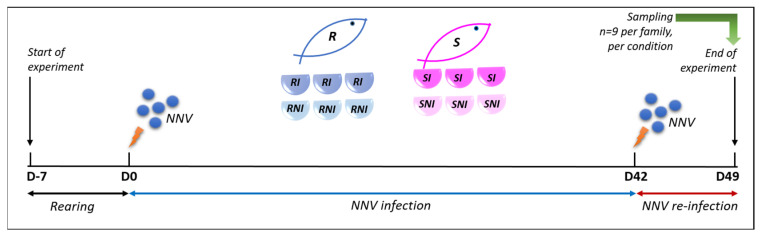
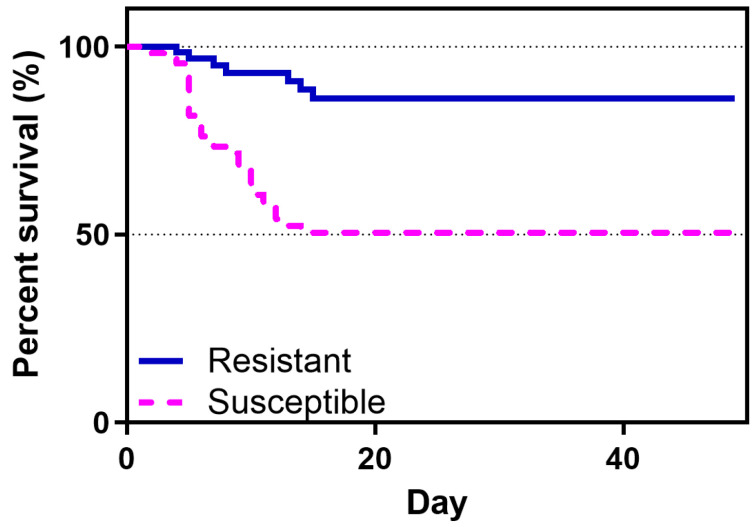
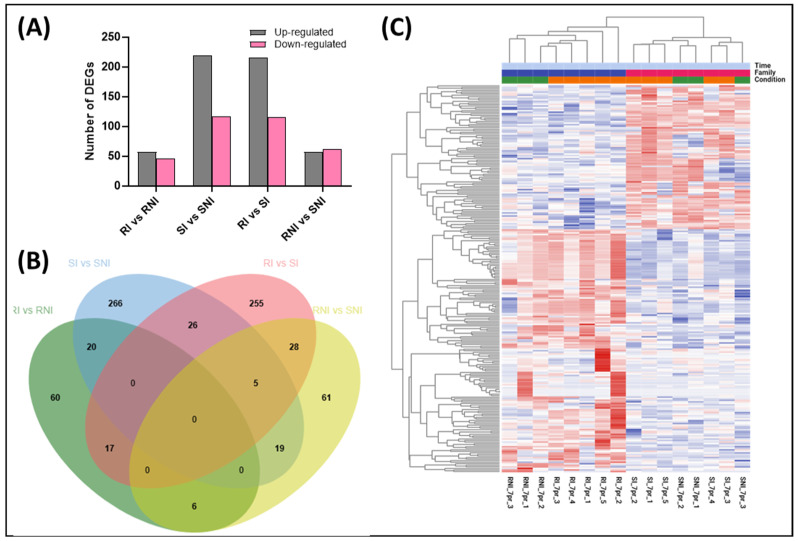
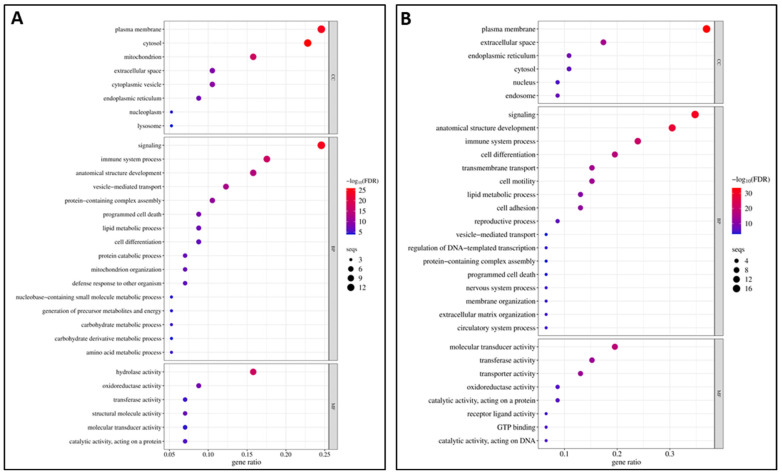
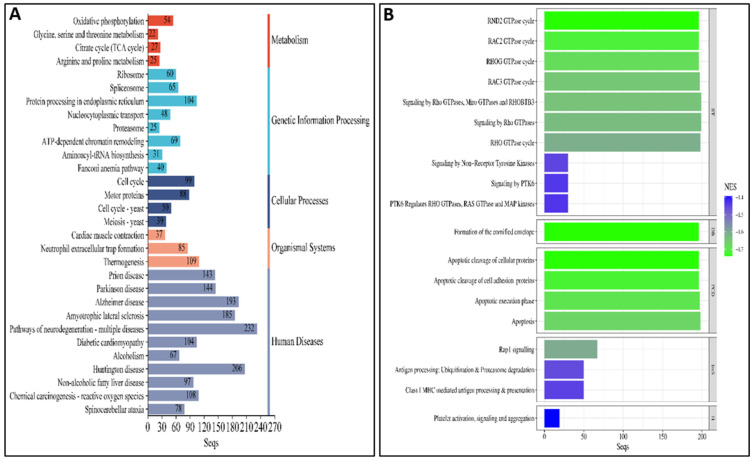
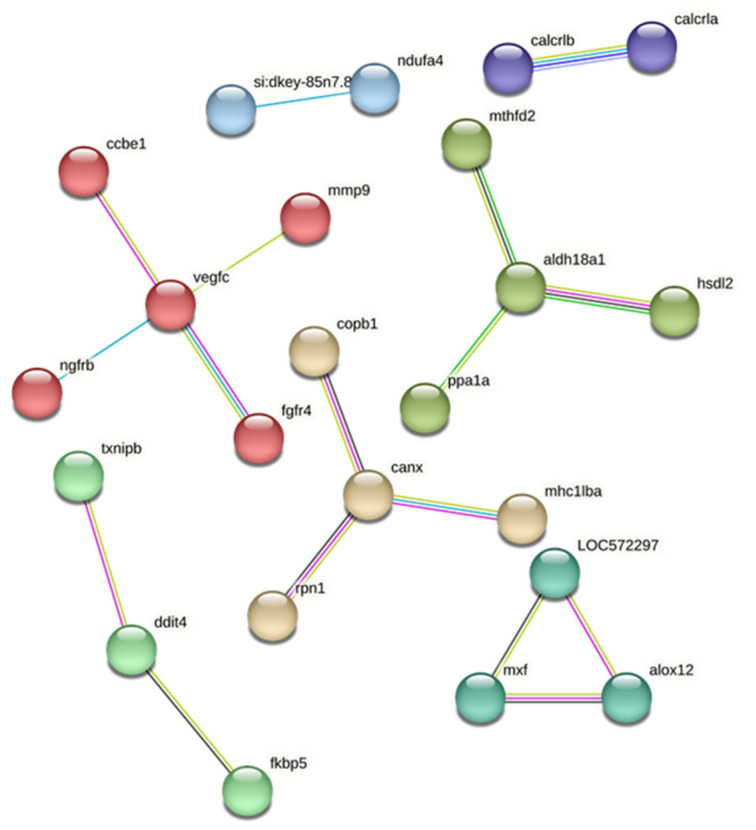
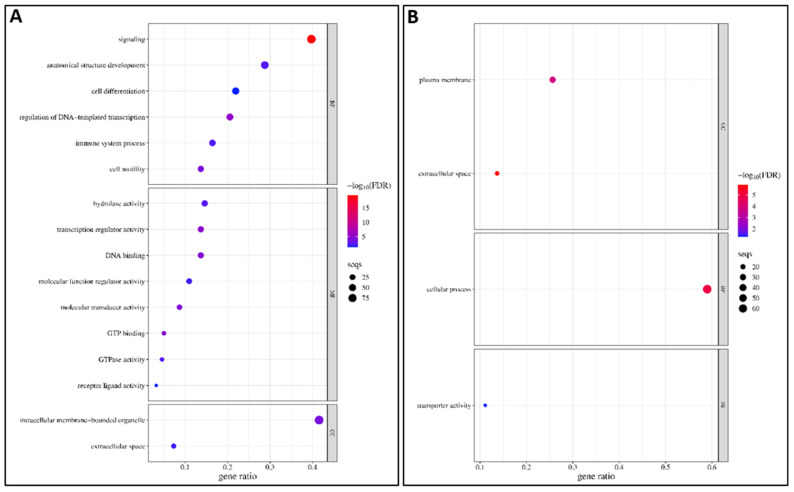
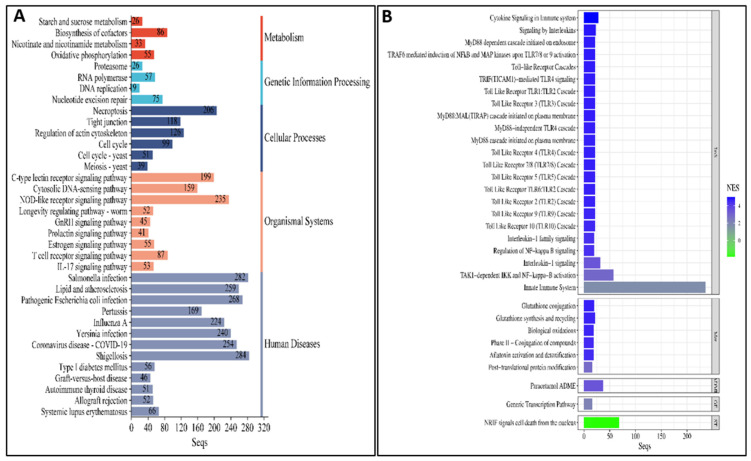
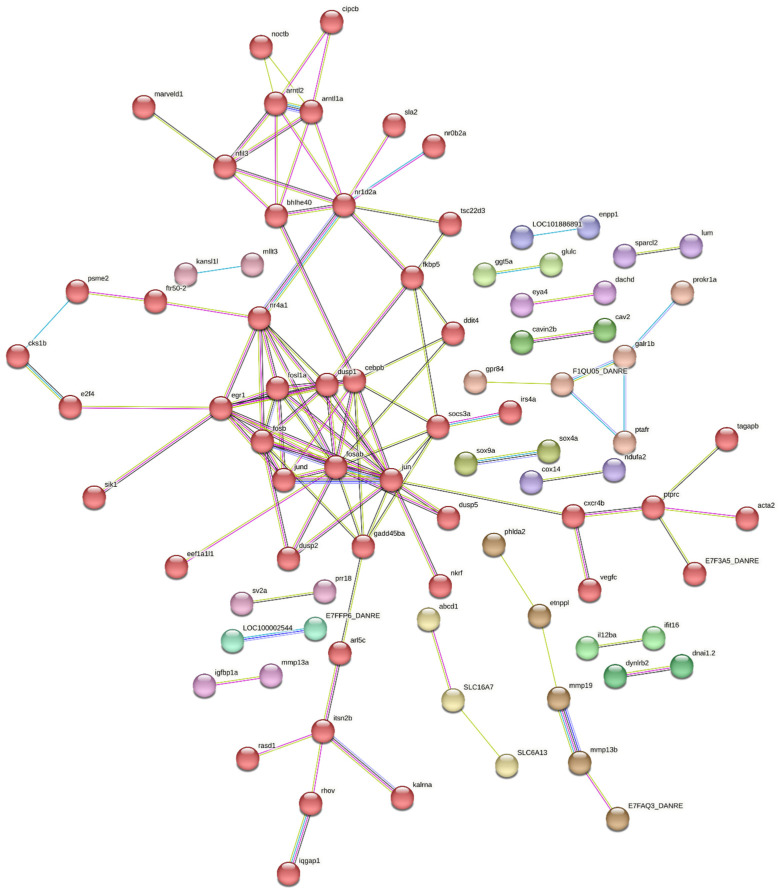
Fish viral infections have great environmental and economic implications in aquaculture. Nervous necrosis virus (NNV) is a pathogen affecting more than 120 different species, causing high mortality and morbidity. Herein, we study how NNV re-infection affects the European sea bass (Dicentrarchus labrax, L.) head kidney transcriptome in disease-resistant and -susceptible sea bass families. To determine how each family responds to re-infection, we performed the RNA-sequencing analysis of experimentally NNV-infected D. labrax. Fish were experimentally infected in a long-term study, and one month after the last recorded death, all surviving fish were re-infected by the same NNV strain. Fish tissues were sampled 7 days upon re-infection. The transcriptome profiles of infected vs. non-infected fish revealed 103 differentially expressed genes (DEGs) for the resistant family and 336 DEGs for the susceptible family. Only a few pathways were commonly enriched in the two families, further indicating that the resistant and susceptible families utilize completely different mechanisms to fight the NNV re-infection. Protein-protein interaction analysis identified a variety of hub genes for the resistant and the susceptible families, quite distinct in their function on NNV resistance. In conclusion, NNV-resistant and -sensitive sea bass transcriptomes were analyzed following NNV survivors' viral re-infection, offering a glimpse into how host attempts to control the infection depending on its genetic background in relation with virus resistance.
Keywords: European sea bass; disease resistance; host–pathogen interaction; nervous necrosis virus; nodavirus; transcriptome; viral nervous necrosis; viral re-infection.
Conflict of interest statement
The authors declare no conflict of interest. The funders had no role in the design of the study; in the collection, analyses, or interpretation of data; in the writing of the manuscript; or in the decision to publish the results.
Figures
Similar articles
-
Temporal profiling of host transcriptome highlights time- and tissue-dependent Interferon pathway activation in NNV-infected European sea bass.Sci Rep. 2025 Jul 10;15(1):24941. doi: 10.1038/s41598-025-09705-5. Sci Rep. 2025. PMID: 40640366 Free PMC article.
-
Nervous Necrosis Virus Modulation of European Sea Bass (Dicentrarchus labrax, L.) Immune Genes and Transcriptome towards Establishment of Virus Carrier State.Int J Mol Sci. 2023 Nov 22;24(23):16613. doi: 10.3390/ijms242316613. Int J Mol Sci. 2023. PMID: 38068937 Free PMC article.
-
Synthetic Peptides Suppress Nervous Necrosis Virus Absorption and Improve Survival Rates in European Sea Bass.Mar Biotechnol (NY). 2025 Aug 23;27(5):128. doi: 10.1007/s10126-025-10507-z. Mar Biotechnol (NY). 2025. PMID: 40848122 Free PMC article.
-
Structured treatment interruptions (STI) in chronic unsuppressed HIV infection in adults.Cochrane Database Syst Rev. 2006 Jul 19;2006(3):CD006148. doi: 10.1002/14651858.CD006148. Cochrane Database Syst Rev. 2006. PMID: 16856117 Free PMC article.
-
Direct-acting antivirals for chronic hepatitis C.Cochrane Database Syst Rev. 2017 Sep 18;9(9):CD012143. doi: 10.1002/14651858.CD012143.pub3. Cochrane Database Syst Rev. 2017. PMID: 28922704 Free PMC article.
References
-
- Munday B.L., Kwang J., Moody N. Betanodavirus infections of teleost fish: A review. J. Fish Dis. 2002;25:127–142. doi: 10.1046/j.1365-2761.2002.00350.x. - DOI
Publication types
MeSH terms
Associated data
Grants and funding
LinkOut - more resources
Full Text Sources
