. 2025 Feb 24;7(1):zcaf006.
doi: 10.1093/narcan/zcaf006. eCollection 2025 Mar.

The IGF2BP1 oncogene is a druggable m6A-dependent enhancer of YAP1-driven gene expression in ovarian cancer

Affiliations

The IGF2BP1 oncogene is a druggable m6A-dependent enhancer of YAP1-driven gene expression in ovarian cancer

Annekatrin Schott et al. NAR Cancer. .

Abstract

The Hippo/YAP1 signaling pathway regulates normal development by controlling contact inhibition of growth. In cancer, YAP1 activation is often dysregulated, leading to excessive tumor growth and metastasis. SRC kinase can cross talk to Hippo signaling by disrupting adherens junctions, repressing the Hippo cascade, or activating YAP1 to promote proliferation. Here, we demonstrate that the IGF2 messenger RNA-binding protein 1 (IGF2BP1) impedes the repression of YAP1 by Hippo signaling in carcinomas. IGF2BP1 stabilizes the YAP1 messenger RNA (mRNA) and enhances YAP1 protein synthesis through an m6A-dependent interaction with the 3' untranslated region of the YAP1 mRNA, thereby increasing YAP1/TAZ-driven transcription to bypass contact inhibition of tumor cell growth. Inhibiting IGF2BP1-mRNA binding using BTYNB reduces YAP1 levels and transcriptional activity, leading to significant growth inhibition in carcinoma cells and ovarian cancer organoids. In contrast, SRC inhibition with Saracatinib fails to inhibit YAP1/TAZ-driven transcription and cell growth in general. This is particularly significant in de-differentiated, rather mesenchymal carcinoma-derived cells, which exhibit high IGF2BP1 and YAP1 expression, rendering them less reliant on SRC-directed growth stimulation. In such invasive carcinoma models, the combined inhibition of SRC, IGF2BP1, and YAP1/TAZ proved superior over monotherapies. These findings highlight the therapeutic potential of targeting IGF2BP1, a key regulator of oncogenic transcription networks.


Conflict of interest statement

None declared.

Figures

Graphical Abstract
Graphical Abstract
Figure 1.
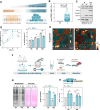
Figure 1.
IGF2BP1 prevents contact inhibition of tumor cell growth. (A) Schematic of elevated mesenchymal-like invasive growth and reduced contact inhibition by the oncogene IGF2BP1 in carcinomas. (B) IGF2BP1 mRNA expression in normal ovarian tissue (NT, GTex v7) versus ovarian cancer (T; TCGA-RNA-seq). (C) Western blot of IGF2BP1 knockdown and overexpression in ES-2 cells. VCL served as loading control. Knockdown and overexpression rates are indicated below panel. (D) IGF2BP1 impacts 2D cell growth at high cell densities. Growth curve of IGF2BP1 overexpression and knockdown cells (panel C) determined by Cell-Titer-Glo® (left panel). Doubling times over a growth period of 72 h were assessed for different initial seeding densities: 25 000 cells/cm² (25K); 50 000 cells/cm² (50K); and 100 000 cells/cm² (100K). (E) IGF2BP1 overexpression impairs the contact inhibition of growth. Representative 3D projections of ES-2 cells overexpressing GFP (G) or GFP–IGF2BP1 (G–I1). Cells were co-labeled by DAPI and Phalloidin at high seeding densities. (F) Schematic depicting the labeling of newly synthesized proteins using CLICK-IT™ chemistry. (G) IGF2BP1 overexpression promotes protein synthesis at high cell densities. Nascent protein production was monitored by pulse-labeling at indicated conditions using Strepavidin-R800 (left panel) labeling. Ponceau staining served as loading control. Relative protein synthesis (to GFP controls) is represented by a bar diagram (right panel). (H) IGF2BP1 overexpression promotes YAP1/TAZ-driven transcription. NanoLuc® activity of transcriptional luciferase reporters (schematic in top panel) harboring four YAP1/TAZ response elements at indicated conditions [SA: Saracatinib at 5 μM; D: DMSO at 0.05% (v/v)] is shown by a bar diagram. Error bars indicate standard deviation (s.d.) of three independent experiments: *P < 0.05; **P< 0.01; ***P < 0.001.
Figure 2.
Figure 2.
IGF2BP1 promotes tumor cell growth by enhancing YAP1 expression. (A) Schematic of the core Hippo signaling pathway. Tumor suppressor genes are indicated in blue, oncogenic factors are shown in red. (B) IGF2BP1 is associated with YAP1 and TEAD4 expression in ovarian cancer. For indicated genes, the bubble chart depicts Pearson correlation (r) with IGF2BP1 expression in EOC (TCGA-OV-304), fold changed expression in ES-2 cells upon IGF2BP1 depletion (KD), and IGF2BP1-CLIP scores [24]. (C) IGF2BP1 is associated with elevated YAP1-driven target gene expression. GSEA upon gene ranking according to IGF2BP1 Pearson correlation with IGF2BP1 (TCGA-OV-304 dataset). The enrichment plot for YAP1 target genes by Galli et al. [53] is shown. (D) IGF2BP1 promotes YAP1 synthesis. Western blot analysis of CRISPR/Cas9-based IGF2BP1 knockout (I1KO) or IGF2BP1 depletion by an siRNA pool (siI1). Distinct YAP1 isoforms, YAP1-1 [1] and YAP1-2 [2], are highlighted. Protein and RNA quantifications are provided below panels. (E) YAP1 re-expression rescues growth and YAP1/TAZ reporter activity upon IGF2BP1 depletion. Western blot analysis of indicated proteins (left panel), NanoLuc® activity of transcriptional YAP1/TAZ reporters (middle panel), and 2D growth of ES-2 cells (right panel) were determined for controls (siC/EV), IGF2BP1-depletion (siI1), and YAP1 re-expression upon IGF2BP1 knockdown (YAP1/siI1). (F) IGF2BP1 depletion impairs YAP1-driven gene expression. GSEA for the YAP1 target gene set by Galli et al. [53] upon gene ranking by the fold change of expression in response to IGF2BP1 depletion in ES-2 cells. Error bars indicate s.d. of three independent experiments: *P < 0.05; **P< 0.01; ***P < 0.001.
Figure 3.
Figure 3.
IGF2BP1 is an m6A-/3′UTR-dependent enhancer of YAP1 mRNA stability. (A) IGF2BP1 associates with the YAP1 mRNA. IGF2BP1-RIP analyses in IGF2BP1-knockout (I1-KO) ES-2 cells re-expressing GFP (control), RNA-binding deficient GFP-IGF2BP1 (control), or GFP-IGF2BP1. RNA enrichment was normalized to inputs and the GFP control. Pulldown controls are shown in Supplementary Fig. S3A. (B) RNA-dependent enhancement of YAP1 by IGF2BP1. Western blot analysis in I1-KO ES-2 cells re-expressing GFP (control), GFP-IGF2BP1 (G-I1), or RNA-binding deficient IGF2BP1 (KH). Protein quantification is depicted in lower panel. (C) IGF2BP1 stabilizes the YAP1 mRNA. RNA turnover analyses in parental ES-2 (WT) and I1-KO cells (KO) following Actinomycin D treatment at indicated timepoints. (D) IGF2BP1 controls YAP1 expression in a 3′UTR-dependent manner. Changes in the activity of luciferase reporters containing the YAP1-3′UTR were determined in ES-2 cells depleted for IGF2BP1 (siI1) or exposed to BTYNB (10 μM). (E) Deletion of the YAP1-3′UTR abolishes regulation by IGF2BP1. The schematic (left panel) shows the strategy of 3′UTR-deletion, as verified by PCR (middle panel). Western blot analysis of YAP1 protein expression (right panel, quantification in lower panel) upon IGF2BP1 depletion in parental (WT) and 3′UTR-deleted ES-2 cells (Δ3′UTR). (F) Modification by m6A promotes IGF2BP1-stimulated YAP1 expression. Western blot analysis of indicated proteins in parental (WT) and METTL3-deleted (M3KO) ES-2 cells upon IGF2BP1 depletion. Protein and mRNA quantification are shown below panel. (G) Modification by m6A promotes association of IGF2BP1 with the YAP1 mRNA. IGF2BP1-RIP analysis in parental and M3KO ES-2 cells stably expressing GFP-IGF2BP1 or GFP as control. RNA enrichments were normalized to inputs and the GFP control. Pulldown controls are shown in Supplementary Fig. S3F. (H) Schematic of IGF2BP1-directed, m6A and 3′UTR-dependent enhancement of YAP1 mRNA stability. Error bars indicate s.d. of three independent experiments: **P< 0.01; ***P < 0.001.
Figure 4.
Figure 4.
IGF2BP1 is a conserved enhancer of YAP1 and its target genes in carcinomas. (A) IGF2BP1 expression is associated with elevated nuclear YAP1 abundance in ovarian cancer. Co-expression of IGF2BP1 and YAP1 was monitored by multicolor fluorescence imaging on a TMA comprising 35 HGSC samples and corresponding metastases in the greater omentum. Representative images (left panel) show protein expression (IGF2BP1 and YAP1) next to representative labeling of nuclei by DAPI and tumor cells by pan-CK staining. Pearson correlation of mean fluorescence intensities per core identified a significant co-expression of IGF2BP1 and YAP1, as depicted by an XY plot (right panel). (B) IGF2BP1 shows conserved association with YAP1/TAZ target gene expression in carcinomas. Bubble plots indicate NESs determined by GSEA of IGF2BP1-correlated gene expression (Pearson) in five carcinomas-based TCGA-deposited RNA-seq datasets. (C) IGF2BP1 is a conserved regulator of YAP1 expression in carcinoma cells. Bubble plots show the fold change in gene expression of core Hippo pathway genes, as determined upon IGF2BP1 depletion in tumor cell lines derived from indicated carcinomas. (D) IGF2BP1 depletion consistently impairs YAP1 expression in carcinoma-derived cell lines. Western blot analysis of IGF2BP1 and YAP1 upon I1-KD in indicated cell lines. Changes in YAP1 protein abundance are shown in the lower panels. (E) IGF2BP1 is a conserved enhancer of YAP1 target genes. GSEA by ranking genes in response to IGF2BP1 depletion identifies consistent downregulation of YAP1 target genes reported by Galli et al. [53] in five carcinoma-derived cell lines. (F) Inhibition of IGF2BP1 by BTYNB consistently reduces YAP1. Western blot analysis of IGF2BP1 and YAP1 in response to BTYNB (10 μM) in indicated cell lines. Changes in YAP1 protein abundance are shown in the lower panels. (G) BTYNB is a conserved inhibitor of YAP1/TAZ-driven transcription. NanoLuc® activity of transcriptional reporters comprising four YAP1/TAZ binding elements (schematic in upper panel) was monitored upon exposure to BTYNB (10 μM) in indicated cell lines. (H) The schematic illustrates inhibition of the IGF2BP1–YAP1 axis by BTYNB. Error bars indicate s.d. of three independent experiments: *P < 0.05; **P< 0.01; ***P < 0.001.
Figure 5.
Figure 5.
IGF2BP1i provides conserved benefits in sensitizing carcinoma cells to SRCi and combined treatment with YAP1/TAZ inhibition. (A) IGF2BP1i by BTYNB impairs 3D growth and 3D invasion in ES-2 cells. Spheroid growth (left panel) and invasion (right panel) of ES-2 was evaluated upon BTYNB exposure at indicated concentrations for 72 h. The spheroid body is highlighted in turquoise. The invasive area is indicated in yellow. The quantitative assessment of spheroid viability, determined by Cell-Titer Glo®, and invasion areas are depicted by a bar diagram (left panel) and XY plots (right panel). (B) Schematic illustrating the impairment of YAP1-driven gene expression by IGF2BP1i (BTYNB), SRCi (Saracatinib), and YAP1/TAZi (Verteporfin). (C) Low potency of SRCi is associated with elevated YAP1/SRC abundancy ratios. Dose-response curves of SRCi for indicated cell lines. EC50-values are indicated. Heatmap shows log2 YAP1/SRC mRNA ratios, as determined by RNA-seq, for respective cell lines. (D) Resistance to SRCi is associated with transcriptional YAP1/TAZ activity. NanoLuc® activity of transcriptional YAP1/TAZ luciferase reporters was monitored in SRCi responsive (turquoise) and resistant (yellow) cell lines. DMSO served as control. (E) SRCi shows strong synergy with YAP1/TAZi in SRCi-resistant cell models. Images depict synergy maps derived by Saracatinib versus Verteporfin drug combination matrices and evaluation by the HSA model [45] for indicated cell lines. Synergy: 10 < δ (delta score) < 100; additivity: 0 < δ < 10; antagonism: δ < −10. (F, G) Combined IGF2BP1i, SRCi, and YAP1/TAZi provides robust and conserved impairment of invasive growth in cell line models and organoids. Invasion and organoid growth were assessed 72 h upon exposure to mono- or combination treatments at indicated concentrations of individual compounds. Representative images are shown. Changes relative to the starting point of the treatment are shown as line plots for indicated conditions. Bar diagrams depict changes relative to DMSO controls (panel G; right panels). Additivity, defined as the summed effects of all compounds, is highlighted in yellow. Error bars indicate standard errors of the mean of three independent experiments: *P < 0.05; ***P < 0.001.

References

    1. Arter ZL, Desmond D, Berenberg JL et al. . Epithelial ovarian cancer survival by race and ethnicity in an equal-access healthcare population. Br J Cancer. 2024; 130:108–13.10.1038/s41416-023-02471-z. - DOI - PMC - PubMed
    1. Ledermann JA, Matias-Guiu X, Amant F et al. . ESGO-ESMO-ESP consensus conference recommendations on ovarian cancer: pathology and molecular biology and early, advanced and recurrent disease. Ann Oncol. 2024; 35:248–66.10.1016/j.annonc.2023.11.015. - DOI - PubMed
    1. Clark KL, George JW, Przygrodzka E et al. . Hippo signaling in the ovary: emerging roles in development, fertility, and disease. Endocr Rev. 2022; 43:1074–96.10.1210/endrev/bnac013. - DOI - PMC - PubMed
    1. Wang D, He J, Dong J et al. . The HIPPO pathway in gynecological malignancies. Am J Cancer Res. 2020; 10:610–29. - PMC - PubMed
    1. Gumbiner BM, Kim NG The Hippo-YAP signaling pathway and contact inhibition of growth. J Cell Sci. 2014; 127:709–17.10.1242/jcs.140103. - DOI - PMC - PubMed

MeSH terms