. 2025 Feb 18;7(1):fcaf075.
doi: 10.1093/braincomms/fcaf075. eCollection 2025.

Metabolic connectivity has greater predictive utility for age and cognition than functional connectivity

Affiliations

Metabolic connectivity has greater predictive utility for age and cognition than functional connectivity

Hamish A Deery et al. Brain Commun. .

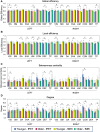
Abstract

Recently developed high temporal resolution functional (18F)-fluorodeoxyglucose positron emission tomography (fPET) offers promise as a method for indexing the dynamic metabolic state of the brain in vivo by directly measuring a time series of metabolism at the post-synaptic neuron. This is distinct from functional magnetic resonance imaging (fMRI) that reflects a combination of metabolic, haemodynamic and vascular components of neuronal activity. The value of using fPET to understand healthy brain ageing and cognition over fMRI is currently unclear. Here, we use simultaneous fPET/fMRI to compare metabolic and functional connectivity and test their predictive ability for ageing and cognition. Whole-brain fPET connectomes showed moderate topological similarities to fMRI connectomes in a cross-sectional comparison of 40 younger (mean age 27.9 years; range 20-42) and 46 older (mean 75.8; 60-89) adults. There were more age-related within- and between-network connectivity and graph metric differences in fPET than fMRI. fPET was also associated with performance in more cognitive domains than fMRI. These results suggest that ageing is associated with a reconfiguration of metabolic connectivity that differs from haemodynamic alterations. We conclude that metabolic connectivity has greater predictive utility for age and cognition than functional connectivity and that measuring glucodynamic changes has promise as a biomarker for age-related cognitive decline.

Keywords: ageing; cognition; fMRI; functional PET; functional connectivity.


Conflict of interest statement

The authors declare no conflicts of interest.

Figures

Graphical Abstract
Graphical Abstract
Figure 1
Figure 1
fPET and fMRI regional time series. Time series for three regions from a single participant after denoising in the CONN toolbox (https://web.conn-toolbox.org/home), including regressing out the white matter and cerebrospinal fluid signal. CONN scales the FDG and BOLD signal at each voxel to the global mean, i.e. the signal average is removed during denoising as a constant term in the regression equation. Hence the time series represents the relative FDG (becquerels) and BOLD signal (arbitrary units). The fPET time series (A–C) was analysed from the 10 min point of the scan to minimize the impact of the initial FDG uptake from the bolus and to reflect the point of a stable signal (i.e. frame zero in the plots A to C correspond to the 10 min point of the scan). The fPET framerate (A–C) was 16 s and the MRI repetition rate (D–F) was one second. Note that connectivity analyses in CONN is scale-invariant.
Figure 2
Figure 2
fPET and fMRI connectomes and covariance among the whole sample (N = 86). (A) fPET connectome, (B) fMRI connectome, (C) across-subject covariance of fPET and fMRI connectomes, (D) Dice–Sørensen coefficient (DICE coefficients) of fPET and fMRI connectome similarity at connection costs and (E) descriptive statistics and z-test of modality differences. VIS, visual; SM, somatomotor; DA, dorsal attention; SVA, salience ventral attention; LIM, limbic; CON, control; DEF, default; TP, temporal parietal.
Figure 3
Figure 3
fPET and fMRI connectomes for younger and older adults using the Schaefer parcellation. (A) Younger (N = 40) and (B) older adult (N = 46) fPET metabolic connectomes, and (C) younger (N = 40) and (D) older adult (N = 46) fMRI connectomes. Connectomes are across the 100 nodes in 8 functional networks. VIS, visual; SM, somatomotor; DA, dorsal attention; SVA, salience ventral attention; LIM, limbic; CON, control; DEF, default; TP, temporal parietal. See Supplementary Table S1 for descriptive statistics and z-tests of differences in within- and between-network connectivity in the connectomes of younger (N = 40) and older (N = 46) adults in fPET and fMRI.
Figure 4
Figure 4
fPET and fMRI within and between-network connectivity for younger and older adults. Within and between-network connectivity was calculated by averaging the nodes within the networks for (A) younger (N = 40) and (B) older (N = 46) adults in fPET, and (D) younger (N = 40) and (E) older adults (N = 46) in fMRI. Within connectivity is shown in the diagonal cells and between connectivity on the off-diagonal cells of each matrix. Significance test (t-test, df = 84) of younger versus older adults, with shaded cells indicating a statistically significant age group differences at P-FDR < 0.05 (C and F). Red shading younger > older; blue shading older > younger. VIS, visual; SM, somatomotor; DA, dorsal attention; SVA, salience ventral attention; LIM, limbic; CON, control; DEF, default; TP, temporal parietal.
Figure 5
Figure 5
fPET and fMRI age group differences in graph metrics. Age group differences in (A) global efficiency, (B) local efficiency, (C) betweenness centrality and (D) degree. Regions are shown as coloured dots where there is a statistically significant difference at P-FDR < 0.05 from one-sided t-tests comparing younger (N = 40) and older (N = 46) adults, and the label indicates the network in which the region belongs. VIS, visual; SM, somatomotor; DA, dorsal attention; SVA, salience ventral attention; LIM, limbic; CON, control; DEF, default; TP, temporal parietal. For each region, the mean, standard deviations, age group effect sizes and t-tests are shown in Supplementary Tables S1–S4. Global efficiency (A) is average of the shortest inverse-distances between the node and all other nodes in the graph; local efficiency (B) is the average of shortest inverse-distances between the nodes within the neighbouring sub-graph; betweenness centrality (C) is the proportion of times that a node is part of a shortest-path between any two nodes within the graph; and degree (D) at each node defined as the number of edges from and to that node.
Figure 6
Figure 6
Mean and standard deviation (error bars) of fPET and fMRI graph metrics for younger and older adults in the Schaefer networks. Global efficiency (A) is average of the shortest inverse-distances between the node and all other nodes in the graph; local efficiency (B) is the average of shortest inverse-distances between the nodes within the neighbouring sub-graph; betweenness centrality (C) is the proportion of times that a node is part of a shortest-path between any two nodes within the graph; and degree (D) at each node defined as the number of edges from and to that node. Differences at *P-FDR < 0.05 and **P-FDR < 0.001 comparing younger (N = 40) versus older (N = 46) adults from one-sided t-tests. U, unique age group differences in one modality; S, Age group differences, same direction in both modalities. VIS, visual; SM, somatomotor; DA, dorsal attention; SVA, salience ventral attention; LIM, limbic; CON, control; DEF, default; TP, temporal parietal.
Figure 7
Figure 7
Multivariate relationships between graph metrics and cognition. Canonical correlations between the whole brain graph metrics from fPET and fMRI (A and C) and cognition (B and D) in the whole sample (N = 86). The r-value is the canonical correlation between the linear combinations of the graph metrics and cognition variables that maximally co-vary across subjects. F-statistic is Wilk’s test of the null hypothesis that the canonical correlation and all smaller ones are equal to zero and was significant for one canonical variate for fPET but not fMRI. The correlations on each variable set represent the strength of the association between the variable and the canonical variate. Variance explained is the percentage of variance explained by the variables in their variate. Stop signal reaction time, seconds per correct response in the digit substitution and category switch reaction time were multiplied by −1 so that higher scores reflect better performance. The test of difference between two correlations = 1.6; P = 0.114 (two-tailed).

References

    1. Fan X, Markram H. A brief history of simulation neuroscience. Front Neuroinform. 2019;13:32. - PMC - PubMed
    1. Jamadar SD, Behler A, Deery H, Breakspear M. The metabolic costs of cognition. Trends Cogn Sci. 2025. [In Press]. 10.31219/osf.io/m5jze. - DOI - PubMed
    1. Conant JB, Cramer RD, Hastings AB, Klemperer A, Solomon AK, Vennesland B. Metabolism of lactic acid containing radioactive carboxyl carbon. J Biol Chem. 1941;137:557–566.
    1. Phelps ME, Huang SC, Hoffman EJ, Selin C, Sokoloff L, Kuhl DE. Tomographic measurement of local cerebral glucose metabolic rate in humans with (F-18)2-fluoro-2-deoxy-D-glucose: Validation of method. Ann Neurol. 1979;6(5):371–388. - PubMed
    1. Sokoloff L. Quantitative measurements of cerebral blood flow in man. Methods Med Res. 1960;8:253–261. - PubMed

LinkOut - more resources