. 2025 Mar 4;14(5):e038341.
doi: 10.1161/JAHA.124.038341. Epub 2025 Feb 26.

Genome-Wide Association Study for Resting Electrocardiogram in the Qatari Population Identifies 6 Novel Genes and Validates Novel Polygenic Risk Scores

Affiliations

Genome-Wide Association Study for Resting Electrocardiogram in the Qatari Population Identifies 6 Novel Genes and Validates Novel Polygenic Risk Scores

Nahin Khan et al. J Am Heart Assoc. .

Abstract

Background: Electrocardiography is one of the most valuable noninvasive diagnostic tools in determining the presence of many cardiovascular diseases. Genetic factors are important in determining ECG abnormalities and their link to cardiovascular diseases. Genome-wide association studies and polygenic risk scores (PRSs) have been conducted for various ECG traits such as QT interval and QRS duration. However, these studies mainly focused on cohorts of European descent.

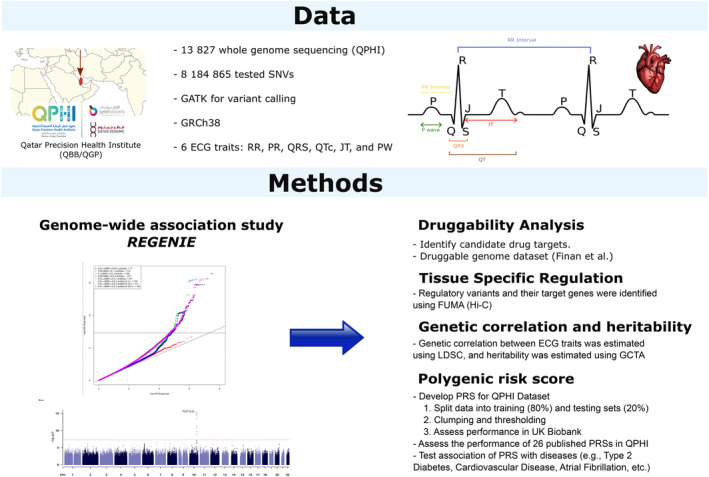
Methods: In this cohort study, genome-wide association studies for 6 ECG traits (RR, PR, corrected QT interval [QTc], QRS, JT, and P wave duration) were conducted in a Middle Eastern cohort from the Qatar Precision Health Institute, comprising 13 827 subjects with whole-genome sequence data. Middle Eastern PRSs were developed using clumping and thresholding, and their performance was compared with 26 published PRSs. Genetic predisposition to long QT syndrome was explored using rare variant analysis.

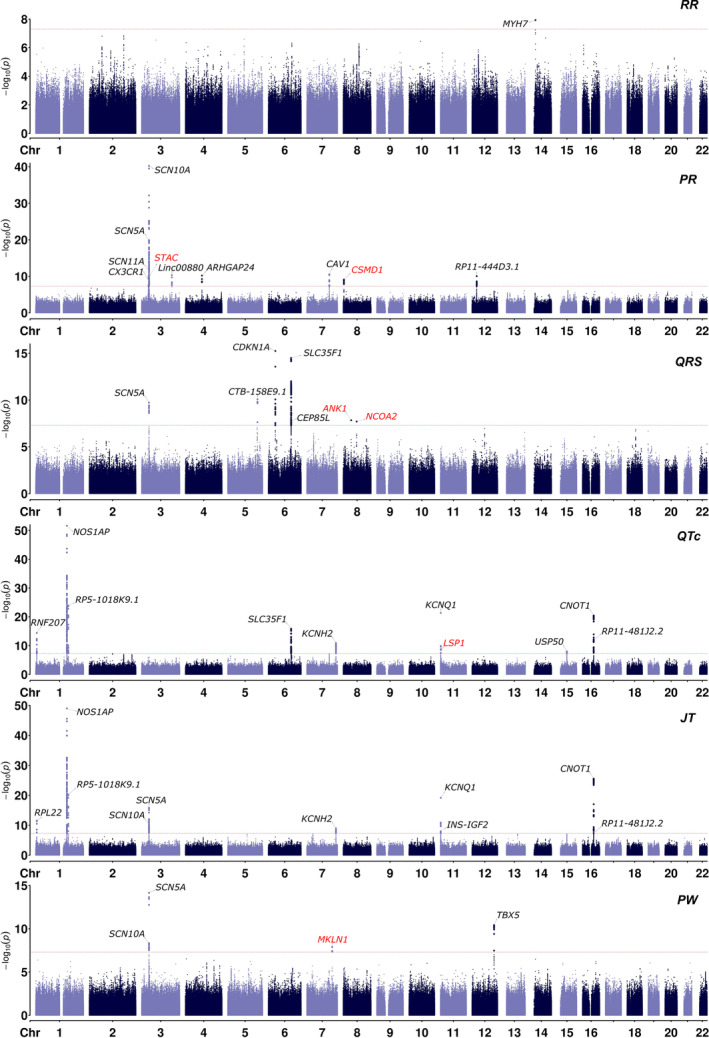
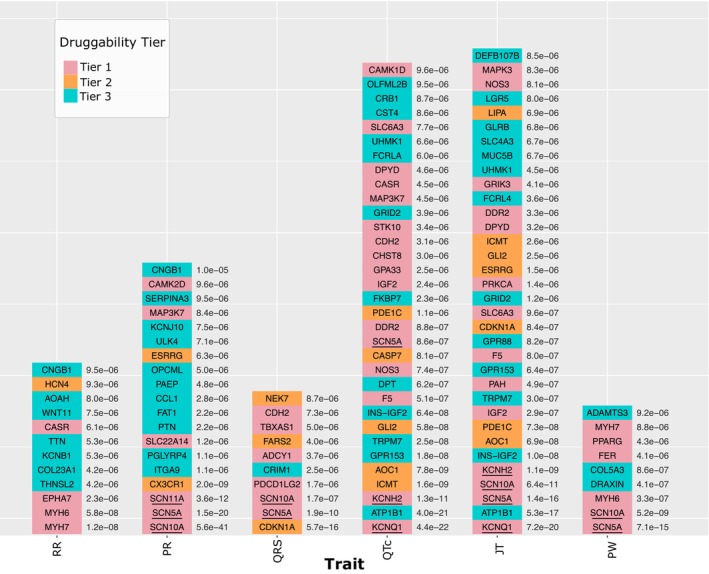
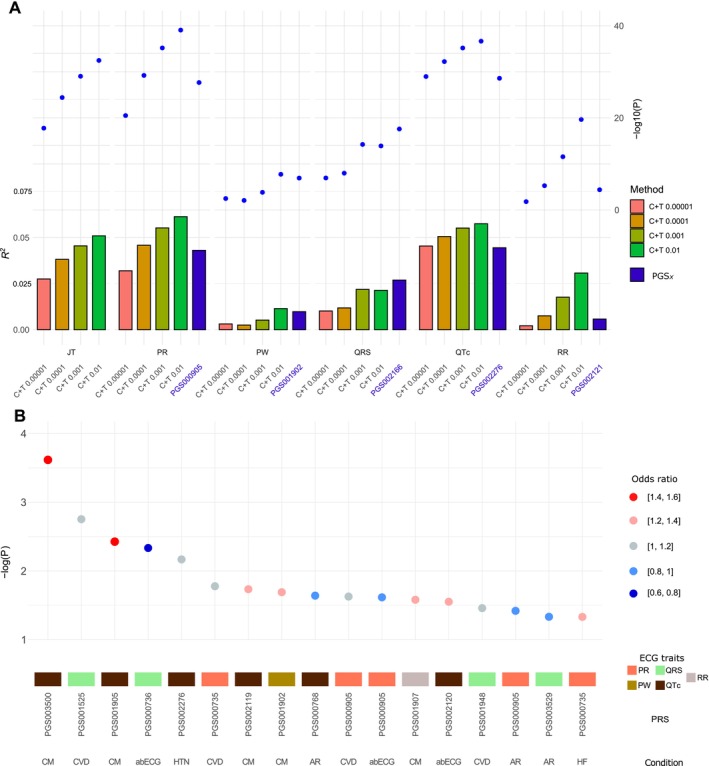
Results: Seventy-four independent loci were obtained with genome-wide significance across the 6 traits (P<5×10⁻⁸). Of the 74 loci, 67 (90.5%) were previously reported, and 7 loci (9.5%) were novel and contained 6 genes: STAC and CSMD1 for PR, ANK1 and NCOA2 for QRS, LSP1 for QTc, and MKLN1 for P wave duration. All 26 published PRSs showed good performance in our cohort. PGS002276 showed the best performance for QTc (R2=0.059, P=4.83×10-185), PGS002166 showed the best performance for QRS (R2=0.024, P=1.53×10-75), and PGS000905 showed the best performance for PR (R2=0.053, P=2.57×10-165). Some of these PRSs were associated with cardiovascular diseases. For example, PGS003500, a QTc PRS, was significantly associated with cardiomyopathy (odds ratio per 1 SD=1.58 [95% CI, 1.23-2.01]; P=2.42×10⁻⁴). Middle Eastern PRSs substantially outperformed published PRSs and did not perform well in the UK Biobank data. Ten pathogenic variants, including 3 that are specific to Qatari individuals, were observed in 17 long QT syndrome genes and were carried by 19 individuals. The QTc average was larger for mutation carriers (415.6±23.5 versus 402.3±18.5 in noncarriers). Five-year follow-up data did not show a significant change in ECG patterns, regardless of mutation status and PRS values. Four of 2302 individuals had prolonged QTc intervals over the 2 time points.

Conclusions: In this first genome-wide association study for ECG traits in the Middle East using whole-genome sequence data, 7 novel loci (6 genes) were identified. Published PRSs performed well, but newly developed Middle Eastern-specific PRSs performed the best. Novel variants in long QT syndrome genes were observed for the first time in Qatari individuals. Follow-up data did not show significant changes in ECG patterns.

Keywords: Middle East; Qatar precision health institute; cardiovascular diseases; diverse populations; electrocardiography; genome‐wide association studies; polygenic risk scores.


Conflict of interest statement

None.

Figures

Figure 1
Figure 1. Study design.
Flowchart that presents the data and main steps of the analysis performed in this study.
Figure 2
Figure 2. Manhattan plots for the 6 ECG traits RR, PR, QRS, QTc, JT, and PW.
The x axis represents the chromosome and location of SNVs, and the y axis represents the ‐log10(P). Annotated genes are shown for the most significant loci. The red‐colored genes are the novel loci identified in our study. PW indicates P wave duration; and SNV, single‐nucleotide variant.
Figure 3
Figure 3. Genetic and phenotypic correlation between ECG traits, top loci overlap, and heritability results.
A, Genetic correlation using LD Score Regression (R g ). B, Phenotypic correlation using Pearson's correlation (R). C, Overlap between the most significant loci of each ECG trait. This is calculated as follows: for each trait on the right‐side y axis, the proportion of the top loci overlapping with the top loci of the trait on the x axis is reported. D, Genome‐wide complex trait analysis heritability estimates using all SNVs, suggestive lead SNVs, and genome‐wide significant lead SNVs. LD indicates linkage disequilibrium; and SNV, single‐nucleotide variant.
Figure 4
Figure 4. Druggability analysis.
The diagram illustrates the potential drug targets from our significant SNVs (P≤10−5) across ECG traits. The genes underlined are known anti‐arrhythmic drug targets as identified using the Kyoto Encyclopedia of Genes and Genomes database. Colors represent the druggability tiers for the drug targets as outlined in the Finan et al database: Tier 1 includes targets of approved drugs and those in clinical development, tier 2 consists of targets with protein sequences that share a similarity (50% similarity across 75% of the sequence length) with targets of approved drugs or drug‐like compounds, and tier 3 comprises targets that correspond to extracellular proteins belonging to prominent drug‐target families such as G protein–coupled receptors. SNV indicates single‐nucleotide variant.
Figure 5
Figure 5. PRS results.
A, The performance of the 4 developed PRSs in the QPHI cohort using C+T methods and the best existing PRS for each trait from the PGS catalog. The performance metric on the left‐side y axis is the squared Pearson's correlation R 2, and the right‐side y axis is the ‐log10(P) of the association between PRS and the tested ECG trait. The performance of all PRSs is evaluated in the testing data set (20% of the cohort) using the PRSonly model. B, The association between existing PRSs and a selected set of cardiovascular‐related diseases. The y axis represents ‐log10(P), where only significant associations are shown (P<0.05). The definition of each disease was done using ICD‐10 codes, which is shown in Table S1. abECG indicates abnormal ECG; AR, arrhythmias; CM, cardiomyopathy; C+T, clumping+thresholding; CVD, cardiovascular disease; HF, heart failure; HTN, hypertension; ICD‐10, International Classification of Diseases, Tenth Revision; PRS, polygenic risk score; PRSonly , ECG–polygenic risk score; QPHI, Qatar Precision Health Institute.

Similar articles

  • Monogenic and Polygenic Contributions to QTc Prolongation in the Population.
    Nauffal V, Morrill VN, Jurgens SJ, Choi SH, Hall AW, Weng LC, Halford JL, Austin-Tse C, Haggerty CM, Harris SL, Wong EK, Alonso A, Arking DE, Benjamin EJ, Boerwinkle E, Min YI, Correa A, Fornwalt BK, Heckbert SR; National Heart, Lung, and Blood Institute Trans-Omics for Precision Medicine (TOPMed) Consortium; Kooperberg C, Lin HJ, J F Loos R, Rice KM, Gupta N, Blackwell TW, Mitchell BD, Morrison AC, Psaty BM, Post WS, Redline S, Rehm HL, Rich SS, Rotter JI, Soliman EZ, Sotoodehnia N, Lunetta KL, Ellinor PT, Lubitz SA; TOPMed Investigators. Nauffal V, et al. Circulation. 2022 May 17;145(20):1524-1533. doi: 10.1161/CIRCULATIONAHA.121.057261. Epub 2022 Apr 7. Circulation. 2022. PMID: 35389749 Free PMC article.
  • Transethnic Genome-Wide Association Study Provides Insights in the Genetic Architecture and Heritability of Long QT Syndrome.
    Lahrouchi N, Tadros R, Crotti L, Mizusawa Y, Postema PG, Beekman L, Walsh R, Hasegawa K, Barc J, Ernsting M, Turkowski KL, Mazzanti A, Beckmann BM, Shimamoto K, Diamant UB, Wijeyeratne YD, Kucho Y, Robyns T, Ishikawa T, Arbelo E, Christiansen M, Winbo A, Jabbari R, Lubitz SA, Steinfurt J, Rudic B, Loeys B, Shoemaker MB, Weeke PE, Pfeiffer R, Davies B, Andorin A, Hofman N, Dagradi F, Pedrazzini M, Tester DJ, Bos JM, Sarquella-Brugada G, Campuzano Ó, Platonov PG, Stallmeyer B, Zumhagen S, Nannenberg EA, Veldink JH, van den Berg LH, Al-Chalabi A, Shaw CE, Shaw PJ, Morrison KE, Andersen PM, Müller-Nurasyid M, Cusi D, Barlassina C, Galan P, Lathrop M, Munter M, Werge T, Ribasés M, Aung T, Khor CC, Ozaki M, Lichtner P, Meitinger T, van Tintelen JP, Hoedemaekers Y, Denjoy I, Leenhardt A, Napolitano C, Shimizu W, Schott JJ, Gourraud JB, Makiyama T, Ohno S, Itoh H, Krahn AD, Antzelevitch C, Roden DM, Saenen J, Borggrefe M, Odening KE, Ellinor PT, Tfelt-Hansen J, Skinner JR, van den Berg MP, Olesen MS, Brugada J, Brugada R, Makita N, Breckpot J, Yoshinaga M, Behr ER, Rydberg A, Aiba T, Kääb S, Priori SG, Guicheney P, Tan HL, Newton-Cheh C, Ackerman MJ, Schwartz PJ, Schulze-Bahr E, Probst V,… See abstract for full author list ➔ Lahrouchi N, et al. Circulation. 2020 Jul 28;142(4):324-338. doi: 10.1161/CIRCULATIONAHA.120.045956. Epub 2020 May 20. Circulation. 2020. PMID: 32429735 Free PMC article.
  • Polygenic risk scores for the prediction of common cancers in East Asians: A population-based prospective cohort study.
    Ho PJ, Tan IB, Chong DQ, Khor CC, Yuan JM, Koh WP, Dorajoo R, Li J. Ho PJ, et al. Elife. 2023 Mar 27;12:e82608. doi: 10.7554/eLife.82608. Elife. 2023. PMID: 36971353 Free PMC article.
  • Precision Medicine in Cardiovascular Disease Prevention: Clinical Validation of Multi-Ancestry Polygenic Risk Scores in a U.S. Cohort.
    Ponikowska M, Di Domenico P, Bolli A, Busby GB, Perez E, Bottà G. Ponikowska M, et al. Nutrients. 2025 Mar 6;17(5):926. doi: 10.3390/nu17050926. Nutrients. 2025. PMID: 40077796 Free PMC article.
  • Polygenic risk scores in kidney transplantation.
    Jelencsics K, Oberbauer R. Jelencsics K, et al. Curr Opin Organ Transplant. 2025 Jun 1;30(3):208-214. doi: 10.1097/MOT.0000000000001212. Epub 2025 Apr 1. Curr Opin Organ Transplant. 2025. PMID: 40171629 Review.

References

    1. AlGhatrif M, Lindsay J. A brief review: history to understand fundamentals of electrocardiography. J Community Hosp Intern Med Perspect. 2012;2:2. doi: 10.3402/jchimp.v2i1.14383 - DOI - PMC - PubMed
    1. Ntalla I, Weng LC, Cartwright JH, Hall AW, Sveinbjornsson G, Tucker NR, Choi SH, Chaffin MD, Roselli C, Barnes MR, et al. Multi‐ancestry GWAS of the electrocardiographic PR interval identifies 202 loci underlying cardiac conduction. Nat Commun. 2020;11:2542. doi: 10.1038/s41467-020-15706-x - DOI - PMC - PubMed
    1. Postema PG, Wilde AA. The measurement of the QT interval. Curr Cardiol Rev. 2014;10:287–294. doi: 10.2174/1573403x10666140514103612 - DOI - PMC - PubMed
    1. Arking DE, Pulit SL, Crotti L, van der Harst P, Munroe PB, Koopmann TT, Sotoodehnia N, Rossin EJ, Morley M, Wang X, et al. Genetic association study of QT interval highlights role for calcium signaling pathways in myocardial repolarization. Nat Genet. 2014;46:826–836. doi: 10.1038/ng.3014 - DOI - PMC - PubMed
    1. van den Berg ME, Warren HR, Cabrera CP, Verweij N, Mifsud B, Haessler J, Bihlmeyer NA, Fu YP, Weiss S, Lin HJ, et al. Discovery of novel heart rate‐associated loci using the exome Chip. Hum Mol Genet. 2017;26:2346–2363. doi: 10.1093/hmg/ddx113 - DOI - PMC - PubMed

MeSH terms

LinkOut - more resources