. 2025 Feb 26;9(3):e0662.
doi: 10.1097/HC9.0000000000000662. eCollection 2025 Mar 1.

Integrative single-cell and spatial transcriptome analysis reveals heterogeneity of human liver progenitor cells

Affiliations

Integrative single-cell and spatial transcriptome analysis reveals heterogeneity of human liver progenitor cells

Chuanjun Liu et al. Hepatol Commun. .

Abstract

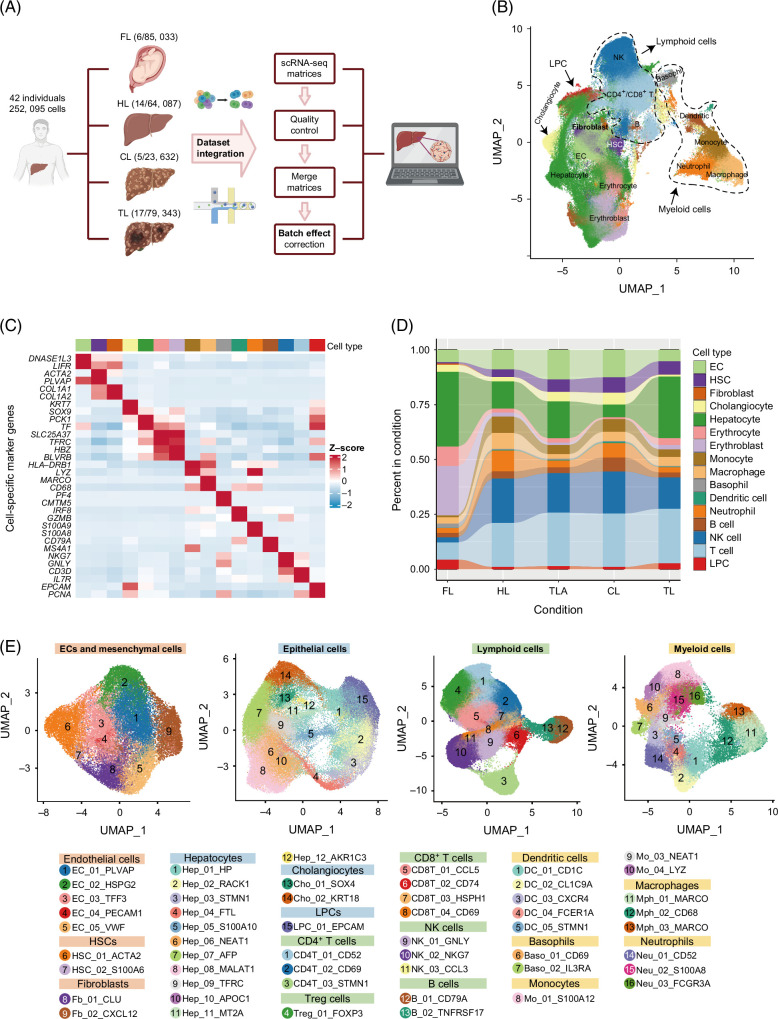
Background: Liver progenitor cells (LPCs) with bipotential differentiation capacities are essential for restoring liver homeostasis and hepatocyte population after damage. However, the low proportion and shared markers with epithelial cells make studying LPC heterogeneity difficult, especially in humans. To address this gap, we explored over 259,400 human liver single cells across 4 conditions (fetal, healthy, cirrhotic, and HCC-affected livers).

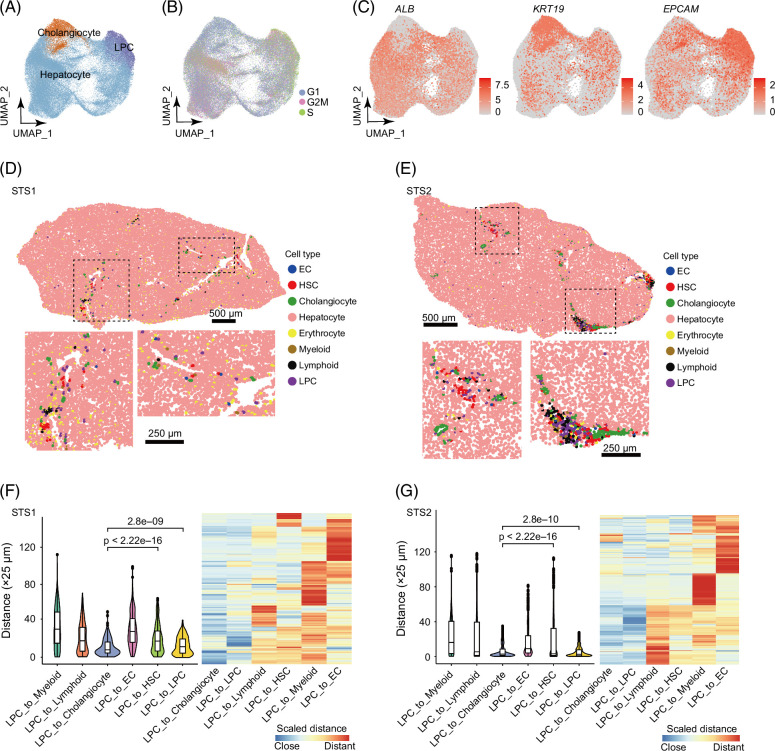
Methods: Human liver tissue samples were analyzed using spatial transcriptomics sequencing technologies to describe the heterogeneity of LPCs. Liver tissue was characterized by LPC heterogeneity at single-cell resolution by employing cellular modules, differentiation trajectories, and gene co-expression patterns.

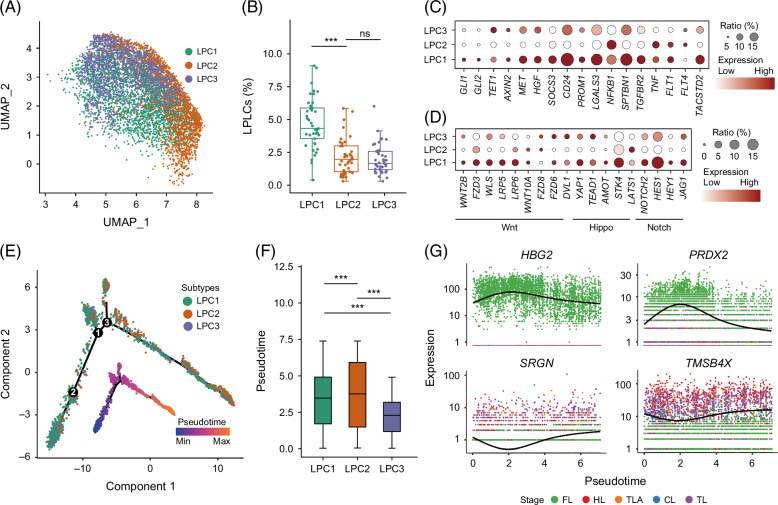
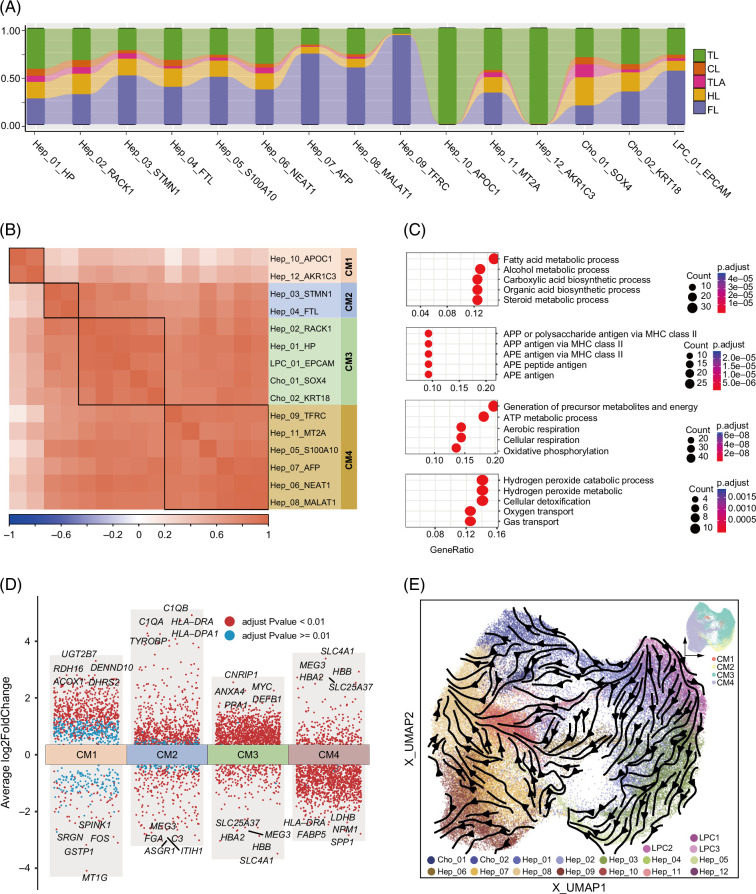
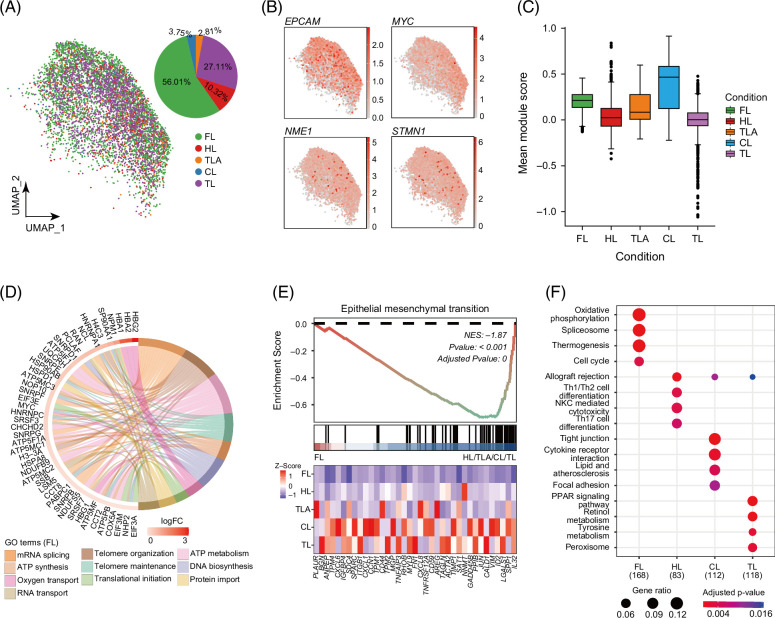
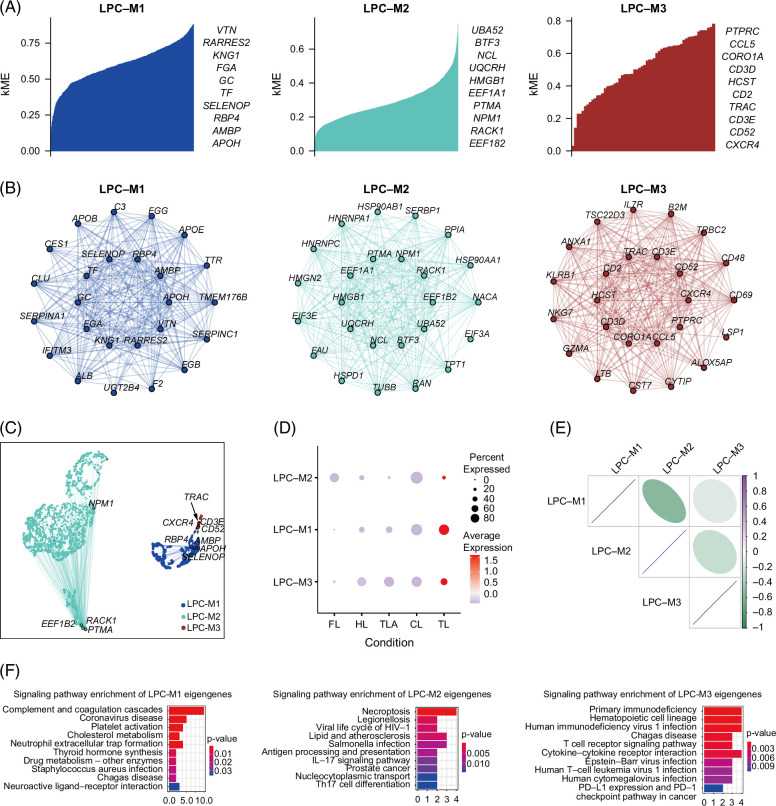
Results: We annotated and identified 1 LPC cluster, 3 LPC subpopulations, and 4 distinct cellular modules, indicating the heterogeneity within LPC and the diversity between LPCs and epithelial cells. LPCs showed spatial colocalization with cholangiocytes and comprised a small proportion (2.95±1.91%) within the merged epithelial cells and LPC populations, exhibiting marked differences in marker expression patterns compared to those in mice. LPCs exhibited distinct cellular states in functional restoration, activation, proliferation, and cell transition. Additionally, the gene co-expression network of LPCs exhibited 3 unique modules, reflecting the distinct connectivity of genes encoding apolipoproteins and heat shock proteins in the gene co-expression network modules.

Conclusions: Our study provides valuable insights into the multifaceted heterogeneity of human LPCs. Future studies focusing on spatial gene expression dynamics will contribute to our understanding of the spatial arrangement of liver regeneration.


Conflict of interest statement

Bhaskar Roy received grants from the National Key R&D program. The remaining authors have no conflicts to report.

Figures

FIGURE 1
FIGURE 1
Integration of scRNA-seq and annotation of cells from the liver under 4 distinct conditions. (A) The schematic diagram illustrated the research workflow: scRNA-seq data from 4 conditions were collected and analyzed. (B) The UMAP clustering plot displayed 15 major cell types from 4 different conditions, including epithelial cells (hepatocytes, cholangiocytes), stromal cells (HSCs, fibroblasts), endothelial cells, erythrocytes, erythroblast, myeloid cells (basophils, neutrophils, dendritic cells, monocytes, and macrophages), and lymphocytes (NK cells, B cells, CD4+/CD8+ T cells). (C) Heatmap analysis used cell-specific marker genes to visualize the average gene expression across cell types. The z-score reflected the gene’s expression level deviation in different clusters from the overall average expression level. A positive z-score signified higher gene expression levels in the specific cluster compared to the average level, while a negative z-score indicated lower expression levels. (D) Sankey diagram illustrated the composition of liver cell types across 4 different conditions. (E) The UMAP plots showed subclusters of 4 major cell lineages: ECs and mesenchymal cells, EPs, lymphoid cells, and myeloid cells. Cluster color codes in the UMAP plots were consistent with cluster IDs in the legend. The rectangular boxes of legends with the same background color indicated that these cells belong to the same cell lineage. Abbreviations: CL, cirrhotic liver; FL, fetal liver; HL, healthy liver; LPC, liver progenitor cell; scRNA-seq, single-cell RNA sequencing; TL, HCC-affected liver of tumor; TLA, tumor-adjacent tissue; UMAP, uniform manifold approximation and projection.
FIGURE 2
FIGURE 2
The distribution of LPCs and epithelial cells on UMAP and spatial transcriptome slices. (A) The UMAP plot displayed 3 major cell types of epithelial cells, including cholangiocytes, hepatocytes, and LPCs. (B) The effects of cell-cycle heterogeneity in epithelial cell clusters and cell-cycle phase scores were calculated based on canonical markers. (C) The dimensional reduction plot was according to the traditional markers of hepatocytes, cholangiocytes, and LPCs. (D, E) Cell types annotated from the spatial transcriptome of sample STS1 and STS2. (F, G) The distance between LPCs and other cell types on the spatial of samples STS1 and STS2 is calculated by the cellbin centroid coordinates of the LPCs and other cell types. Abbreviations: EC, endothelial cell; LPC, liver progenitor cell; UMAP, uniform manifold approximation and projection.
FIGURE 3
FIGURE 3
The subpopulation and trajectory of LPCs. (A) Clustering LPCs into 3 subtypes. (B) Box plots illustrated the proportions of LPC1–LPC3 in epithelial cells (hepatocytes and cholangiocytes) and LPCs, and significant differences were determined through the Wilcoxon testing. (C) The dot plot showed the expression and proportion of LPC markers in 3 subtypes. (D) Genes expression patterns of the LPC-related pathways, Wnt, Hippo, and Notch signaling. (E) In the diversity cell trajectory of LPC with Monocle, the colors of points represented 4 conditions, and the lines showed differentiation paths. Pseudotime on the trajectory graph, the color dark blue to light yellow indicates an increased pseudotime. (F) The boxplot illustrated the distribution of pseudotime across different conditions. (G) The expression characteristics of genes along the pseudotime and their distribution at different conditions. Colors indicated different liver conditions. Abbreviations: CL, cirrhotic liver; FL, fetal liver; HL, healthy liver; LPC, liver progenitor cell; TL, HCC-affected liver of tumor; TLA, tumor-adjacent tissue; UMAP, uniform manifold approximation and projection.
FIGURE 4
FIGURE 4
Heterogeneity and cellular module of epithelial cells. (A) The proportion of cells within each condition that constituted each subcluster. (B) The 4 cellular modules were based on correlations of cell clusters across 4 conditions. (C) The biological processes of gene ontology enrichment for CM1–CM4 markers were depicted in 4 figures, arranged in descending order from CM1 to CM4. (D) Differentially expressed genes of CM1–CM4 using average log2-fold change, adjusted p values <0.01 were highlighted in red, whereas adjusted p values ≥0.01 were displayed in blue. (E) The trajectory inference streamline plot of LPCs, cholangiocytes, and hepatocytes revealed that LPCs differentiate into cholangiocytes and hepatocytes along distinct transformative paths, the legend of the subclusters omitted gene names. The thumbnail in the top right shows the cell distribution of cellular modules. Abbreviations: APE, antigen processing and presentation of exogenous; APP, antigen processing and presentation; CL, cirrhotic liver; FL, fetal liver; HL, healthy liver; LPC, liver progenitor cell; TL, HCC-affected liver of tumor; TLA, tumor-adjacent tissue; UMAP, uniform manifold approximation and projection.
FIGURE 5
FIGURE 5
Signatures of LPCs among 4 conditions. (A) The UMAP analysis of LPCs from 4 distinct conditions constituent types were labeled in the UMAP map and pie chart. (B) The scale bar represented the normalized gene expression level of 4 liver progenitor makers. (C) Mean module score of LPC markers (EPCAM, TACSTD2, FGFR2, TM4SF4, CLDN1, ANXA4, WWTR1, MYC, STMN1, PSMA4, SNRPB, ERH, NME1, TMEM14B) that account for liver regeneration. (D) The circularly composited FL differentially expressed genes and their top 10 GO biological process. (E) Gene set heatmap and gene set enrichment analysis plot depicted the enrichment of epithelial–mesenchymal transition of FL. (F) The unique pathways of LPCs enriched in FL, HL, CL, and TL. Abbreviations: CL, cirrhotic liver; FL, fetal liver; GO, gene ontology; HL, healthy liver; LPC, liver progenitor cell; TL, HCC-affected liver of tumor; TLA, tumor-adjacent tissue; UMAP, uniform manifold approximation and projection.
FIGURE 6
FIGURE 6
Co-expression network analysis based on LPC gene expression and signaling pathways of GCN eigengenes. (A) Genes in each module ranked by eigengene-based connectivity (kME) in LPC, where kME was calculated within a group comprising the 4 conditions and a total of 3 hdWGCNA modules were identified. (B) The module network of each module’s top 25 hub genes. Each plot depicted genes as nodes connected by edges denoting co-expression relationships. Node colors correspond to module assignments, with the top 10 hub genes centrally positioned and the remaining 15 arranged in the outer circle. (C) Co-expression networks visualization. The uniform manifold approximation and projection (UMAP) algorithm was applied to visualize the co-expression network data, and each point represented a single gene, each gene’s position in UMAP space based on its connectivity with the network’s hub genes. The size of each point corresponded to the gene’s kME value within its assigned module. The color of the points corresponded to the 3 different modules in A. (D) The dot plot showed harmonized module eigengenes (hMEs) by conditions. (E) Correlation heatmap of modules based on hub gene scores. (F) Signaling pathway enrichment of GCN top 25 eigengenes. Abbreviations: GCN, gene co-expression network; LPC, liver progenitor cell.

Similar articles

References

    1. So J, Kim A, Lee SH, Shin D. Liver progenitor cell-driven liver regeneration. Exp Mol Med. 2020;52:1230–1238. - PMC - PubMed
    1. Lukacs-Kornek V, Lammert F. The progenitor cell dilemma: Cellular and functional heterogeneity in assistance or escalation of liver injury. J Hepatol. 2017;66:619–630. - PubMed
    1. Yamazaki T, Enosawa S, Kasahara M, Fukuda A, Sakamoto S, Shigeta T, et al. . Isolation of hepatic progenitor cells from human liver with cirrhosis secondary to biliary atresia using EpCAM or Thy-1 markers. Cell Med. 2012;3:121–126. - PMC - PubMed
    1. Sharma A, Seow JJW, Dutertre CA, Pai R, Blériot C, Mishra A, et al. . Onco-fetal reprogramming of endothelial cells drives immunosuppressive macrophages in hepatocellular carcinoma. Cell. 2020;183:377–394. - PubMed
    1. Aizarani N, Saviano A, Sagar, Mailly L, Durand S, Herman JS, et al. . A human liver cell atlas reveals heterogeneity and epithelial progenitors. Nature. 2019;572:199–204. - PMC - PubMed