Synthesis and characterization of coumarin-derived sulfur analogues using Lawesson's reagent
- PMID: 40009018
- PMCID: PMC11881164
- DOI: 10.1107/S2053229625000956
Synthesis and characterization of coumarin-derived sulfur analogues using Lawesson's reagent
Abstract
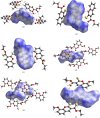
The synthesis and characterization of six novel coumarin derivatives containing O and S atoms are described here, namely, ethyl 2-oxo-2H-chromene-3-carboxylate, C12H10O4 (S1a), ethyl 2-sulfanylidene-2H-chromene-3-carboxylate, C12H10O3S (S2a), ethyl 2-sulfanylidene-2H-chromene-3-carbothioate, C12H10O2S2 (S3a), ethyl 8-methoxy-2-oxo-2H-chromene-3-carboxylate, C13H12O5 (S1b), ethyl 8-methoxy-2-sulfanylidene-2H-chromene-3-carboxylate, C13H12O4S (S2b), and ethyl 8-methoxy-2-sulfanylidene-2H-chromene-3-carbothioate, C13H12O3S2 (S3b). Compounds S1a/b were synthesized in good yields following the Knoevenagel condensation method. The thiocarbonyl analogues of these compounds, S2a/b and S3a/b, were obtained using Lawesson's reagent as a thionating compound. The structures of S2a/b and S3a/b were confirmed using FT-IR, 1H and 13C NMR, and UV-Vis spectroscopy, and single-crystal X-ray diffraction. Hirshfeld surface and energy framework analyses show that stacked π-π ring interactions occur for all the structures obtained here, and various hydrogen-bond interactions link the stacks to form three-dimensional energy frameworks.
Keywords: Hirshfeld surface; Knoevenagel; Lawesson's reagent; UV–Vis absorption; chemosensor; coumarin; crystal structure; energy framework; thionation; topology.
open access.
Figures


 , −z +
  ; (ii) −x, −y + 1, −z; (iii) x, −y +
  , z +
, z +  ; (iv) x, −y +
  , z −
, z −  ; for S2a: (i) x, −y +
  , z −
, z −  ; (ii) −x + 1, y +
  , −z +
  ; for S3a: (i) x, y − 1, z; (ii) −x +
  , −y +
  , −z + 1; for S1b: (i) −x +
  , y +
, y +  , −z +
  ; (ii) −x + 1, −y + 1, −z; (iii) −x +
  , y −
, y −  , −z +
  ; for S2b: (i) −x +
  , y −
, y −  ; (iii) −x +
  , y +
, y +  , −z +
  ; (iv) x +
  , −y +
  , z +
, z +  ; (v) −x + 2, −y + 1, −z + 1; for S3b: (i) −x + 1, y +
  , −z +
  ; (iii) x − 1, y, z.

References
-
- Bakhtiari, G., Moradi, S. & Soltanali, S. A. (2014). Arab. J. Chem.7, 972–975.
-
- Bernstein, J., Davis, R. E., Shimoni, L. & Chang, N.-L. (1995). Angew. Chem. Int. Ed. Engl.34, 1555–1573.
-
- Bojtár, M., Kormos, A., Kis-Petik, K., Kellermayer, M. & Kele, P. (2019). Org. Lett.21, 9410–9414. - PubMed
-
- Bruker (2012). APEX2, SAINT and SADABS. Bruker AXS Inc., Madison, Wisconsin, USA.
LinkOut - more resources
Full Text Sources
Research Materials
Miscellaneous

