. 2025 Feb 26;82(1):94.
doi: 10.1007/s00018-025-05614-y.

Occlusion of TCR binding to HLA-A*11:01 by a non-pathogenic human alloantibody

Affiliations

Occlusion of TCR binding to HLA-A*11:01 by a non-pathogenic human alloantibody

Maryam Hamidinia et al. Cell Mol Life Sci. .

Abstract

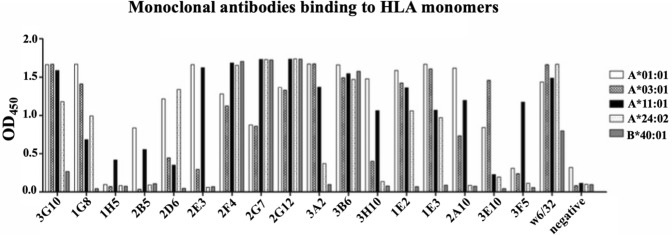
Over the last decades, organ transplantation has made rapid progress as a curative therapy for organ failure. However, the adaptive immune system-alloreactive T cells and antibodies targeting human leukocyte antigens (HLA)-is the leading cause of graft rejection. The presence of anti-donor HLA antibodies is considered a risk factor that disqualifies a particular donor-recipient pair. However, alloantibodies are found in some long-term graft survivors, suggesting a protective blocking function of some alloantibodies. Therefore, whether alloantibodies can have a positive as well as a negative effect in transplantation remains unclear. Here, HLA-A*11:01-specific monoclonal antibodies were generated from a human non-immune antibody library, and the effect of these antibodies was investigated on activation of A*11:01- specific T cells. We identified an A*11:01-specific monoclonal antibody with the capacity to block TCR recognition, TCR recruitment to the immune synapse, and T cell activation. The antibody reduced translocation of the transcription factor NFAT1 and phosphorylation of the MAP kinase ERK, which are both required for T cell effector function and TCR signal transduction. Cross-linking mass spectrometry was used to identify the epitope, demonstrating that this alloantibody can inhibit TCR from binding to the HLA molecule. These findings indicate that some HLA-specific alloantibodies can reduce T cell responses to the allograft. This has significant implications for interpretation of the existence of donor-specific antibodies, since some of them can protect the graft. Moreover, such antibodies may have therapeutic potential as specific treatments targeting mismatched donor HLA molecules.

Keywords: Alloantibody; Cross-linking mass spectrometry (XL-MS); Donor-specific antibodies (DSA); Human antibody; Transplantation.


Conflict of interest statement

Declarations. Conflict of interests: The authors declare no competing interests. Ethical approval: Peripheral blood was obtained after Institutional Review Board approval. Informed consent was obtained from healthy volunteers (NUS-IRB Reference Code: H-17-057).

Figures

Fig. 1
Fig. 1
Allelic reactivity of human IgG1 monoclonal antibodies defined by their binding to HLA monomers, assessed by ELISA
Fig. 2
Fig. 2
a Illustration of the procedure of HLA-A*11:01-restricted T cell generation. A*11:01+ PBMCs from healthy donors were seeded in 24 well plates, stimulated with different A*11:01+ peptides, and maintained for 10 days at 37 °C with 5% CO2 in a cell incubator. Recombinant human IL-2 was added on day 2 and from day 5, every 2 to 3 days, half of the medium was exchanged with fresh media supplemented with IL-2. Tetramer staining and intracellular staining for TNF and IFNγ cytokines were carried out to assess the responding population of T cells. b, c Functional assessment of A*11:01-restricted syngeneic T cells. b Illustrative comparison of Tetramer staining before and after T-cell stimulation with the EBV EBNA-3BNP peptide. Left panel shows the frequency of HLA A*11:01/EBNA-3BNP tetramer binding CD8+ T lymphocytes before T cell stimulation, right panel shows this frequency after stimulation. Two different fluorophores (PE-Cy5 and PE-Cy7) were used for A*11:01 MHC tetramerization to enhance the specificity of the staining. CMV peptide was used as an irrelevant peptide for MHC tetramer assay staining. c Intracellular staining of TNF and IFNg following stimulation with the EBV EBNA-3BNP peptide. A*11:01+ BLCLs were used as stimulator cells, some were loaded with EBV EBNA-3BNP peptide, and some cells were stimulated with CMV peptide as an irrelevant peptide and negative control
Fig. 3
Fig. 3
a Illustration of procedure for cell stimulation and antibody treatment before intracellular staining. 5 mg/mL of the EBV EBNA-3B peptide was loaded into A*11:01+ BLCLs. After 1 h of incubation, cells were washed once to remove unloaded peptides and then treated with anti-HLA A*11:01 or control monoclonal antibodies. After 1 h of incubation, cells were washed again and cocultured with the expanded EBNA-3BNP CD8+ T cells at a ratio of 4:1 (T cell: BLCL). After 6 h of incubation, cytokine production was assessed via intracellular staining. A*11:01-restricted T cell activation is reduced by anti-A*11:01 antibody cocktail and by 1H5 monoclonal antibody. b In all groups, BLCLs were loaded/pulsed with the EBV EBNA-3BNP peptide except the first left column where cells were pulsed with CMV peptide as an irrelevant peptide and negative control for the peptide validation. Positive control means expanded CD8+ T cells stimulated with PMA plus ionomycin were used as positive control. c–g The effect of 5 different anti-HLA A*11:01 monoclonal antibodies was assessed separately within concentration ranges between 5 and 40 mg/mL. To differentiate non-specific antibody binding from the specific antibody binding, some cells were treated with 40 mg/mL of the Ultra-Leaf Purified Human IgG1 isotype control recombinant antibody and used as a negative control. All the values were compared to the isotype control and analyzed by Prism software using two-tailed Student’s t-test. * p < 0.10, ** p < 0.05, *** p < 0.01 and **** p < 0.001. Data are representative of three independent experiments
Fig. 4
Fig. 4
Reduced IL-2 production in the presence of anti-A*11:01 1H5 monoclonal antibody. APCs expressing the A*11:01 heavy chain: a K562 cells, b BLCL, c T2 cells, were pulsed with the HLA A*11:01 EBV LMP-2 340–349 peptide and MP1 as an irrelevant peptide for 1 h. After washing cells, anti-A*11:01 monoclonal antibodies were added to each well. Subsequently, EBV TCR CD8αβ+ transduced Jurkat 76 cells were added to each well at a ratio of 1:4 (stimulator:responder). IL-2 ELISA assay was performed on the supernatant after 20 h. d Affinity of 1H5 binding to A*11:01 was estimated by ELISA. Dissociation equilibrium constant of 1H5-IgG1 antibody binding to HLA A*11:01 monomers was approximately 77 pM when measured by ELISA (mean ± s.d., n = 3)
Fig. 5
Fig. 5
TCR signaling is reduced in the presence of 1H5 antibody. a Percentage of NFAT nuclear translocation in EBV TCR CD8αβ+-transduced Jurkat 76 cells stimulated with T2 cells expressing HLA A*11:01. b Representative images of EBV TCR CD8αβ+ transduced Jurkat 76 cells labeled for nucleus using DAPI and for NFAT with anti-NFAT Ab (D43B1). Anti-A*11:01 antibody 2E3 was used for comparison as a non-blocking anti-A*11:01 antibody. c Percentage of pERK nuclear translocation in EBV TCR CD8αβ+-transduced Jurkat 76 cells stimulated with T2 cells expressing HLA A*11:01. d Representative images of EBV TCR CD8αβ+-transduced Jurkat 76 cells labeled for pERK and for nucleus using DAPI. Data are representative of three independent experiments. All data were analysed using Student’s two-tailed t-test **: P < 0.005, ***: P ≤ 0.0005, ns (not significant): P ≥ 0.05. e–g EBV TCR transduced Jurkat 76 cells on the surface of lipid bilayer in the presence of anti-A*11:01 (1H5) and (2E3) monoclonal antibodies. In e and f, cells are clearly attached to the supported lipid bilayer presenting MHC class I and LMP2A peptide in the presence of Human IgG1 isotype control antibody (e) and anti-A*11:01 2E3 antibody (f). g In the presence of anti-A*11:01 1H5 antibody, the cells did not bind to the supported lipid bilayer. h–k Interaction between EBV TCR CD8αβ+-transduced Jurkat 76 cells and T2 cells expressing the A*11:01. h Full image. ik Representative image of a conjugate showing immune synapse formation. CD3 was stained with APC anti-CD3 antibody (i, blue) and CD8 was stained with PE anti-CD8 antibody (j, red). k Shows the merged image. l Anti-A*11:01 1H5 antibody reduced the CD3 recruitment to the immune synapse. Data are representative of three independent experiments. All data were analyzed using Student’s two-tailed t-test **: P < 0.005, *** P ≤ 0.0005, ns (not significant): P ≥ 0.05.
Fig. 6
Fig. 6
HLA allele reactivity of 1H5 measured by SAB assay. 1H5 mAb was spiked in negative control serum to a final concentration of 2 mg/mL and 10 mg/mL. ac Binding activity to common HLA-A, B, and C alleles was evaluated using commercial SAB assay by an accredited laboratory. d–f Pymol visualization of predicted HLA A*11:01 epitope. Amino acid residues that are most likely to be part of the epitope are labeled in red on (e). Others that are also likely to be part of the epitope are labeled in purple
Fig. 7
Fig. 7
Cross-linking mass spectrometry guided modeling of 1H5 mAb to A*11:01 interaction shows a 1H5 mAb binding site that occludes TCR binding. a Circular plot of all cross-links identified for 1H5 mAb to A*11:01 protein complex. b xiView plot of cross-links between 1H5 mAb to A*11:01, with DSSO (red) and SDA (green) cross-links. A*11:01 sequence is annotated with predicted eplets (green) while 1H5 mAb CDR regions are marked in red. Residues which are cross-linked are marked in gray. c–f modeled structures. c, e Top and side view of modeled structure of 1H5 mAb (blue) to A*11:01 (gray). Modeling done based on molecular docking with inputs from XLMS data, predicted interacting surface, predicted 1H5 fv structure and solved A*11:01 structure (PDB: 6ID4). d, f Top and side view of modeled structure of 1H5 mAb to A*11:01 with TCR binding site superimposed on structure. Red arrow highlights the steric clash in TCR binding and 1H5 mAb binding to A*11:01. g Top view of modeled 1H5 mAb to A*11:01 with four hydrogen bonding regions marked in black and numbered 1–4. h–k Zoom-in view of hydrogen bonding regions numbered 1, 2, 3, 4 in g, respectively. Residues on A*11:01 are numbered with the HLA alpha helix annotated for frame of reference. 1H5 mAb residues are marked as AbH for heavy chain and AbL for light chain residues

References

    1. Ochando J, Fayad ZA, Madsen JC, Netea MG, Mulder WJM (2020) Trained immunity in organ transplantation. Am J Transplant 20(1):10–18 - PMC - PubMed
    1. Anasetti C (2008) What are the most important donor and recipient factors affecting the outcome of related and unrelated allogeneic transplantation? Best Pract Res Clin Haematol 21(4):691–697 - PMC - PubMed
    1. Macdonald WA, Chen Z, Gras S, Archbold JK, Tynan FE, Clements CS et al (2009) T cell allorecognition via molecular mimicry. Immunity 31(6):897–908 (Epub 2010/01/13) - PubMed
    1. Kawase T, Morishima Y, Matsuo K, Kashiwase K, Inoko H, Saji H et al (2007) High-risk HLA allele mismatch combinations responsible for severe acute graft-versus-host disease and implication for its molecular mechanism. Blood 110(7):2235–2241 (Epub 2007/06/08) - PubMed
    1. Felix NJ, Allen PM (2007) Specificity of T-cell alloreactivity. Nat Rev Immunol 7(12):942–953 (Epub 2007/11/17) - PubMed

MeSH terms