. 2025 May 8;145(19):2149-2160.
doi: 10.1182/blood.2024026934.

STING activation improves T-cell-engaging immunotherapy for acute myeloid leukemia

Affiliations

STING activation improves T-cell-engaging immunotherapy for acute myeloid leukemia

Andreas Linder et al. Blood. .

Abstract

T-cell-recruiting bispecific antibodies (BsAbs) are in clinical development for relapsed/refractory acute myeloid leukemia (AML). Despite promising results, early clinical trials have failed to demonstrate durable responses. We investigated whether activation of the innate immune system through stimulator of interferon (IFN) genes (STING) can enhance target cell killing by a BsAb targeting CD33 (CD33 bispecific T-cell engager molecule; AMG 330). Indeed, we show that cytotoxicity against AML mediated by AMG 330 can be greatly enhanced when combined with the STING agonist 2',3'-cyclic guanosine monophosphate-adenosine monophosphate (cGAMP) or diamidobenzimidazole (diABZI). We used in vitro cytotoxicity assays, immunoblotting, transcriptomic analyses, and extensive CRISPR-Cas9 knockout experiments to investigate the enhancing effect of a STING agonist on the cytotoxicity of AMG 330 against AML. Importantly, we validated our findings with primary AML cells and in a xenograft AML model. Mechanistically, in addition to direct cytotoxic effects of STING activation on AML cells, activated T cells render AML cells more susceptible to STING activation through their effector cytokines, IFN-γ and tumor necrosis factor, resulting in enhanced type I IFN production and induction of IFN-stimulated genes. This feeds back to the T cells, leading to a further increase in effector cytokines and an overall cytotoxic T-cell phenotype, contributing to the beneficial effect of cGAMP/diABZI in enhancing AMG 330-mediated lysis. We established a key role for IFN-γ in AMG 330-mediated cytotoxicity against AML cells and in rendering AML cells responsive to STING agonism. Here, we propose to improve the efficacy of CD33-targeting BsAbs by combining them with a STING agonist.


Conflict of interest statement

Conflict-of-interest disclosure: M.S. receives industry research support from Amgen, Bristol Myers Squibb (BMS)/Celgene, Gilead/Kite, Johnson & Johnson, Miltenyi Biotec, Novartis, Roche, Seattle Genetics, and Takeda; and serves as a consultant/advisor for AbbVie, Crossbow, Debiopharm, Gilead/Kite, Interius, Johnson & Johnson, Molecular Partners, Novartis, and Otsuka; and serves on the speakers’ bureau at Amgen, BMS/Celgene, Gilead/Kite, Miltenyi Biotec, Novartis, Roche, and Takeda. R.K. is employed by Amgen; and holds stock ownership in Amgen. V.B. has received research funding from Gilead/Kite and Miltenyi Biotec; educational grants from BMS, Novartis, Takeda, and Roche; served as a consultant/advisor for Amgen, Gilead/Kite, Novartis, Pfizer, and Priothera; and serves on the speakers’ bureau for Novartis and Pfizer. S.K. has received honoraria from Cymab, Plectonic, TCR2 Inc, Miltenyi Biotec, Galapagos, Novartis, BMS, and GlaxoSmithKline; is an inventor of several patents in the field of immuno-oncology; received license fees from TCR2 Inc and Carina Biotech; and received research support from TCR2 Inc, Tabby Therapeutics, CatalYm GmbH, Plectonic GmbH, and Arcus Biosciences for work unrelated to the manuscript. The remaining authors declare no competing financial interests.

Figures

None
Graphical abstract
Figure 1.
Figure 1.
The STING agonist cGAMP enhances AMG 330–mediated cytotoxicity against AML cells. (A-B) Flow cytometric analysis of AMG 330–mediated (5 ng/mL) cytotoxicity after 72 hours against HL-60 cells in cocultures with either CD8+ (A) or CD4+ (B) human T cells (n = 4). Specific lysis was calculated relative to the c-BiTE condition. The concentration of added cGAMP in cocultures was 40 μg/mL. (C-D) Effector-to-target cell ratio–dependent cytotoxicity after 72 hours against HL-60 cells in cocultures with either CD8+ (C) or CD4+ (D) human T cells treated as indicated (n = 3). (E) Percentage of caspase-3–positive HL-60 cells measured by intracellular staining and flow cytometry after 72 hours of coculture with human Pan–T cells treated as indicated (n = 3). (F) The percentage of granzyme B+ T cells, determined by intracellular staining and flow cytometry after 72 hours in cocultures with HL-60 cells treated as indicated (n = 3). (G) The percentage of TRAIL+ T cells, determined by flow cytometry after 72 hours in cocultures with HL-60 cells (n = 6). (H) Flow cytometric analysis of T-cell degranulation measured by staining surface CD107a after 72 hours in cocultures with HL-60 cells treated as indicated (n = 3). (I-J) Secretion of IFN-γ and TNF, determined after 72 hours by cytometric bead array (CBA) analysis, from cocultures of human T cells and HL-60 cells treated as indicated (n = 3). (K) Human T-cell proliferation expressed as fold change in CD2+ cells on day 6 of coculture with HL-60 cells in the presence of AMG 330 ± 10 μg/mL cGAMP (E:T of 1:20) normalized to c-BiTE conditions (n = 3). After 3 days, half of the medium was exchanged with fresh medium containing AMG 330 ± cGAMP. All graphs present the mean ± standard error of the mean (SEM). Statistical analysis was performed using ordinary 1-way analysis of variance (ANOVA) with the Tukey comparison or the 2-way ANOVA with Šidák correction (panels C-D). ns, P > .05; ∗P < .05; ∗∗P < .01; ∗∗∗P < .001. E:T, effector-to-target cell ratio; ns, not significant.
Figure 2.
Figure 2.
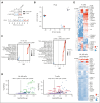
Transcriptional responses to IFN-α, IFN-γ, and TNF underlie the improved target cell killing in the presence of cGAMP. (A) Overview of bulk RNA sequencing approach; HL-60 and human T cells were cocultured for 8 hours in the presence of AMG 330 ± cGAMP and separated by FACS before subjecting them to RNA sequencing. c-BiTE conditions served as control. (B) Principal component analysis (PCA) applied to the RNA sequencing data collected from the 4 experimental conditions and the 2 indicated cell types (as outlined in panel A; n = 3). (C) Gene set enrichment analysis for the comparison of c-BiTE and AMG 330 + cGAMP in HL-60 and T cells. Normalized enrichment score (NES) is depicted for the indicated hallmark gene sets; the size of the dot represents the adjusted P value for each gene set. (D) Volcano plot showing the gene expression differences between cGAMP treatment and combined AMG 330 + cGAMP treatment in HL-60 cells (left) and AMG 330 treatment and combined AMG 330 + cGAMP treatment in T cells (right). Negative log10-adjusted P values (y-axis) are plotted against the log2-transformed fold changes in gene expression (x-axis). Significantly upregulated (adjusted P < .05; absolute fold change > 2) genes are shown in blue, with genes associated with an ISG response highlighted in green (left) and genes associated with T-cell activation highlighted in red (right). (E) Heat maps of the top 200 most variable genes in HL-60 and T cells clustered hierarchically across all conditions; relevant genes are highlighted. Color coding corresponds to normalized and log2-transformed read counts. FACS, fluorescence activated cell sorting; PC1, principal component 1.
Figure 3.
Figure 3.
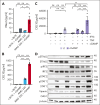
IFN-γ and TNF sensitize AML cells to STING agonism. (A-B) Levels of IFN-α2a (A) or CXCL10 (B) measured after 72 hours by CBA (IFN-α2a) or ELISA (CXCL-10), from cocultures of human T cells and HL-60 cells treated as indicated (E:T, 1:10; n = 3). (C) Levels of CXCL-10 measured after 16 hours in the supernatant of HL-60 cells treated as indicated (IFN-γ, 20 ng/mL; TNF, 0.5 ng/mL; cGAMP, 40 μg/mL). (D) Immunoblots of lysates of HL-60 cells treated for 16 hours as indicated (IFN-γ, 20 ng/mL; TNF, 20 ng/mL; cGAMP, 40 μg/mL). Means ± SEM are presented. Statistical analysis was performed using the ordinary 1-way ANOVA with the Tukey comparison or the 2-way ANOVA with the Tukey comparison (panel C). ns, P > .05; ∗P < .05; ∗∗P < .01; ∗∗∗P < .001. ELISA, enzyme-linked immunosorbent assay; ns, not significant.
Figure 4.
Figure 4.
Intrinsic STING signaling in target AML cells is required for enhancing AMG 330–mediated lysis. (A) Immunoblots of monoclonal HL-60 cell lines of the indicated genotypes generated by CRISPR-Cas9 gene editing. (B) Monoclonal HL-60 cell lines of the indicated genotypes were treated with IFN-α2a, and phosphorylation of STAT1 (pSTAT1) was determined by immunoblotting. (C) Flow cytometric analysis of AMG 330–mediated (5 ng/mL) cytotoxicity after 72 hours against HL-60 cell lines of the indicated genotypes (mean of 2 independent knockout clones) in cocultures with human T cells (E:T, 1:10, n = 3). Specific lysis was calculated relative to the c-BiTE condition. The concentration of added cGAMP in cocultures was 40 μg/mL. (D-E) Levels of IFN-γ (D) and IL-2 (E) as determined by CBA analysis of cocultures of human T cells and wild-type or STING-deficient HL-60 cells in the presence of the indicated treatments after 72 hours (n = 3). Means ± SEM are presented. Statistical analysis was performed using the 2-way ANOVA with the Tukey comparison. ns, P > .05; ∗P < .05; ∗∗∗P < .001. E:T, effector-to-target ratio; ns, not significant; WT, wild-type.
Figure 5.
Figure 5.
Intrinsic STING signaling in target AML cells requires priming by effector T-cell–derived cytokines. (A) HL-60 cell lines of the indicated genotypes were treated with IFN-γ or TNF, and pSTAT1 or phosphorylation of IκBα (pIκBα) was assessed by immunoblotting. (B) Flow cytometric analysis of AMG 330–mediated (5 ng/mL) cytotoxicity against HL-60 cell lines of the indicated genotypes (mean of 2 independent knockout clones) in cocultures with human T cells after 72 hours (E:T, 1:10; n = 3). Specific lysis was calculated relative to the c-BiTE condition. The concentration of added cGAMP in cocultures was 40 μg/mL. (C-D) Levels of IFN-α2a (C) and IFN-γ (D) determined after 72 hours by CBA analysis of the supernatants of cocultures of human T cells and HL-60 cells of the indicated genotype in the presence of c-BiTE or AMG 330 ± cGAMP (n = 3). Means ± SEM are presented. Statistical analysis was performed using the 2-way ANOVA with the Tukey comparison. ns, P > .05; ∗P < .05; ∗∗P < .01; ∗∗∗P < .001. E:T, effector-to-target ratio; ns, not significant; WT, wild-type.
Figure 6.
Figure 6.
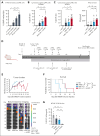
Combination of STING agonism and CD33-directed T-cell–engaging molecules efficiently eliminates pAML cells and shows superior in vivo efficacy. (A) Flow cytometric analysis of cGAMP-mediated cytotoxicity after 48 hours against pAML cells (n = 4). (B) Flow cytometric analysis of AMG 330–mediated (0.5 ng/mL) cytotoxicity after 48 hours against pAML cells in cocultures with human T cells (E:T, 1:10; n = 10). Specific lysis was calculated relative to the c-BiTE condition. The concentration of added cGAMP in cocultures was 10 μg/mL. (C) Flow cytometric analysis of AMG 330–mediated (0.5 ng/mL) cytotoxicity after 48 hours against pAML cells in cocultures with human T cells (E:T, 1:10; n = 11). The concentration of added diABZI in cocultures was 1 nM. Corresponding levels of secreted IFN-γ as determined by CBA analysis are shown. (D) Timeline and overview of the AML xenograft model. Injections are indicated with arrows (n = 3 mice per group). (E-F) Tumor burden was analyzed by bioluminescence imaging, and probability of survival is depicted after Kaplan-Meier analysis. (G) MOLM-13 tumor burden in the bone marrow of mice was analyzed by flow cytometric analysis at the time of euthanasia. Means ± SEM are presented. Statistical analysis was performed using the ordinary 1-way ANOVA with the Tukey comparison or the Kaplan-Meier analysis with the Mantel-Cox test (panel F). ns, P > .05; ∗P < .05; ∗∗P < .01; ∗∗∗P < .001. E:T, effector-to-target ratio; i.p., intraperitoneal; ns, not significant.

Comment in

References

    1. Stelljes M, Krug U, Beelen DW, et al. Allogeneic transplantation versus chemotherapy as postremission therapy for acute myeloid leukemia: a prospective matched pairs analysis. J Clin Oncol. 2014;32(4):288–296. - PubMed
    1. Gale RP, Horowitz MM, Ash RC, et al. Identical-twin bone marrow transplants for leukemia. Ann Intern Med. 1994;120(8):646–652. - PubMed
    1. Orti G, Barba P, Fox L, Salamero O, Bosch F, Valcarcel D. Donor lymphocyte infusions in AML and MDS: enhancing the graft-versus-leukemia effect. Exp Hematol. 2017;48:1–11. - PubMed
    1. Cappell KM, Kochenderfer JN. Long-term outcomes following CAR T cell therapy: what we know so far. Nat Rev Clin Oncol. 2023;20(6):359–371. - PMC - PubMed
    1. Gurumurthi A, Westin JR, Subklewe M. The race is on: bispecifics vs CAR T-cells in B-cell lymphoma. Blood Adv. 2023;7(19):5713–5716. - PMC - PubMed

MeSH terms

Substances