

Error-corrected ultradeep next-generation sequencing for detection of clonal haematopoiesis and haematological neoplasms - sensitivity, specificity and accuracy
- PMID: 40009600
- PMCID: PMC11864513
- DOI: 10.1371/journal.pone.0318300
Error-corrected ultradeep next-generation sequencing for detection of clonal haematopoiesis and haematological neoplasms - sensitivity, specificity and accuracy
Abstract
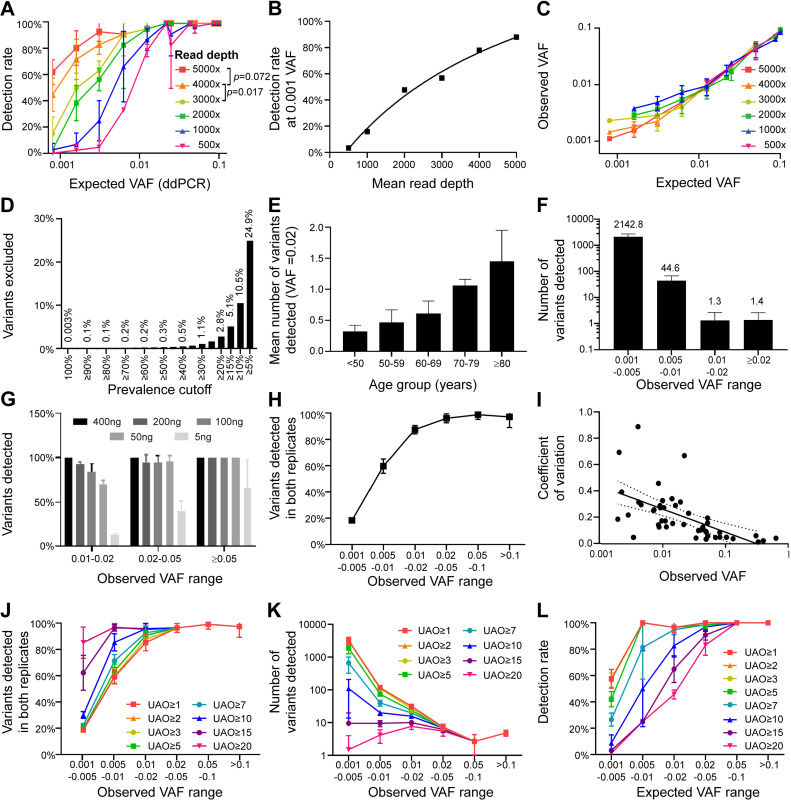
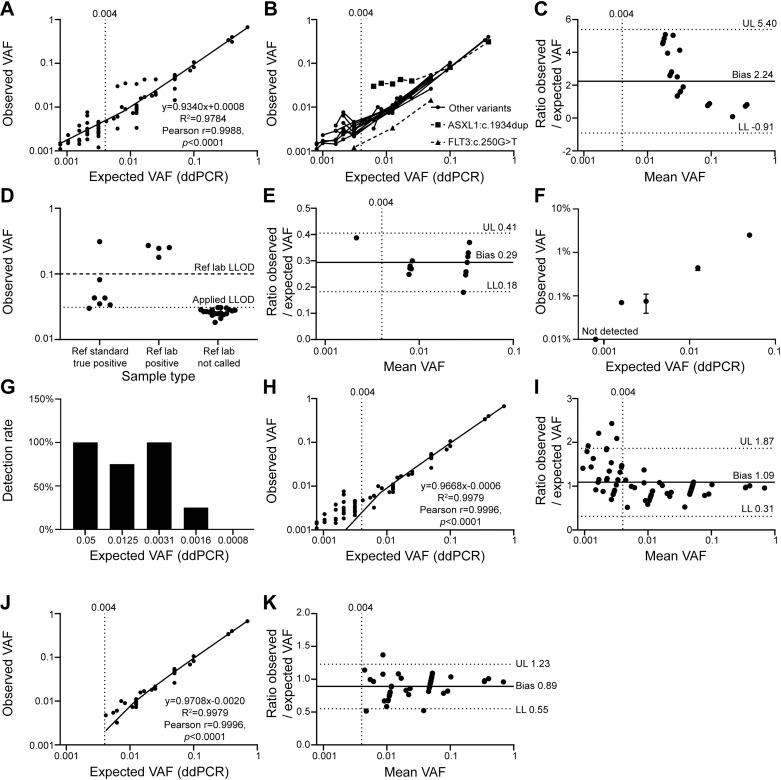
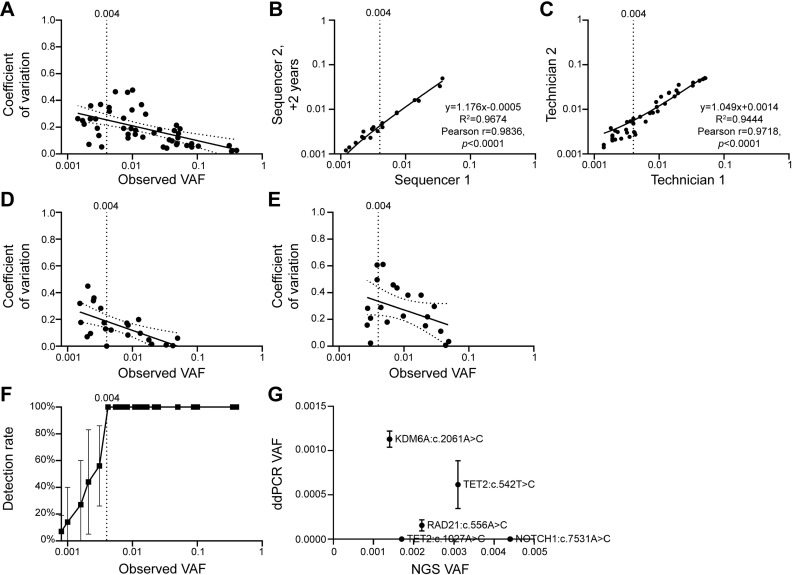
Clonal haematopoiesis of indeterminate potential (CHIP) is an aging-associated phenomenon that has recently been correlated with a broad spectrum of human diseases, including haematological malignancy, cytopenia, coronary heart disease, stroke, and overall mortality. CHIP is defined as a somatic variant in blood cells with an allele frequency (VAF) ≥ 0.02, however recent reports show smaller clones are associated with poorer clinical outcome. Error-corrected ultradeep next-generation sequencing (NGS) assays detecting variants < 0.02 VAF also have clinical value for monitoring measurable residual disease (MRD) for myeloid neoplasms. However, limited data are available on optimal parameters, limits of detection, and accuracy of ultra-sensitive detection. We investigated parameters to improve accuracy of Illumina sequencing-by-synthesis method, including read depth, input DNA quantity, and molecular barcoding-based data filtering, while adhering to clinical accreditation criteria. Validation data were generated from reference standards and reference samples from a clinically accredited pathology laboratory. Analytical range measurements included linearity and bias, and precision included repeatability, reproducibility and detection rate. The lower limit of detection was ≥ 0.004 (0.4%) at depth > 3,000 × . Trueness measured using reference standards demonstrated a sensitivity, specificity, positive and negative predictive values, and accuracy of 100%, including FLT3-ITD, and 100% concordance was achieved with reference samples for reported variants and absence of variants. Sequencing blood samples from 383 community-dwelling adults (mean depth 3758×) revealed 2,190 somatic variants/sample, > 99.9% were < 0.02 VAF. Our data including cost-benefit analysis enables pathology and research laboratories to make informed decisions for detection of CHIP (VAF ≥ 0.02), sub-CHIP (VAF 0.01-0.02) and MRD (VAF ≥ 0.004).
Copyright: © 2025 Tursky et al. This is an open access article distributed under the terms of the Creative Commons Attribution License, which permits unrestricted use, distribution, and reproduction in any medium, provided the original author and source are credited.
Conflict of interest statement
The authors have declared that no competing interests exist.
Figures
Similar articles
-
Quantitative and Qualitative QC of Next-Generation Sequencing for Detecting Somatic Variants: An Example of Detecting Clonal Hematopoiesis of Indeterminate Potential.Clin Chem. 2020 Jun 1;66(6):832-841. doi: 10.1093/clinchem/hvaa088. Clin Chem. 2020. PMID: 32395759
-
Measurable residual disease monitoring for patients with acute myeloid leukemia following hematopoietic cell transplantation using error corrected hybrid capture next generation sequencing.PLoS One. 2019 Oct 28;14(10):e0224097. doi: 10.1371/journal.pone.0224097. eCollection 2019. PLoS One. 2019. PMID: 31658273 Free PMC article.
-
Saliva-derived DNA is suitable for the detection of clonal haematopoiesis of indeterminate potential.Sci Rep. 2024 Aug 14;14(1):18917. doi: 10.1038/s41598-024-69398-0. Sci Rep. 2024. PMID: 39143154 Free PMC article.
-
Biomarkers in clonal haematopoiesis of indeterminate potential (CHIP) linking cardiovascular diseases, myeloid neoplasms and inflammation.Ann Hematol. 2025 Mar;104(3):1355-1366. doi: 10.1007/s00277-025-06244-x. Epub 2025 Feb 24. Ann Hematol. 2025. PMID: 39988580 Free PMC article. Review.
-
Clonal hematopoiesis: Molecular and clinical implications.Leuk Res. 2022 Feb;113:106787. doi: 10.1016/j.leukres.2022.106787. Epub 2022 Jan 10. Leuk Res. 2022. PMID: 35091334 Review.
References
-
- Miles B, Tadi P. Genetics, Somatic Mutation. Treasure Island (FL): StatPearls; 2022. - PubMed
-
- Jaiswal S, Fontanillas P, Flannick J, Manning A, Grauman PV, Mar BG, et al.. Age-related clonal hematopoiesis associated with adverse outcomes. N Engl J Med. 2014; 371(26): 2488–98. Available from: https://doi.org/10.1056/NEJMoa1408617 - DOI - PMC - PubMed
MeSH terms
LinkOut - more resources
Full Text Sources
Miscellaneous
