. 2025 Feb 28;11(9):eads6417.
doi: 10.1126/sciadv.ads6417. Epub 2025 Feb 26.

Transformation of flg22 perception into electrical signals decoded in vasculature leads to sieve tube blockage and pathogen resistance

Affiliations

Transformation of flg22 perception into electrical signals decoded in vasculature leads to sieve tube blockage and pathogen resistance

Alexandra C U Furch et al. Sci Adv. .

Abstract

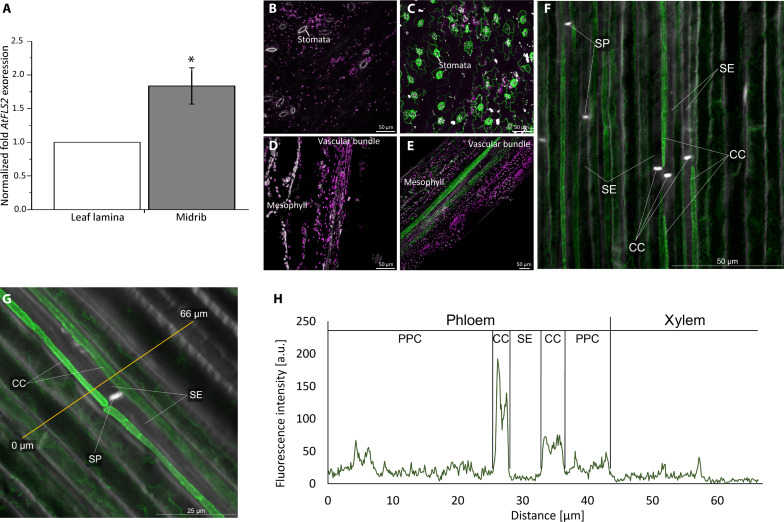
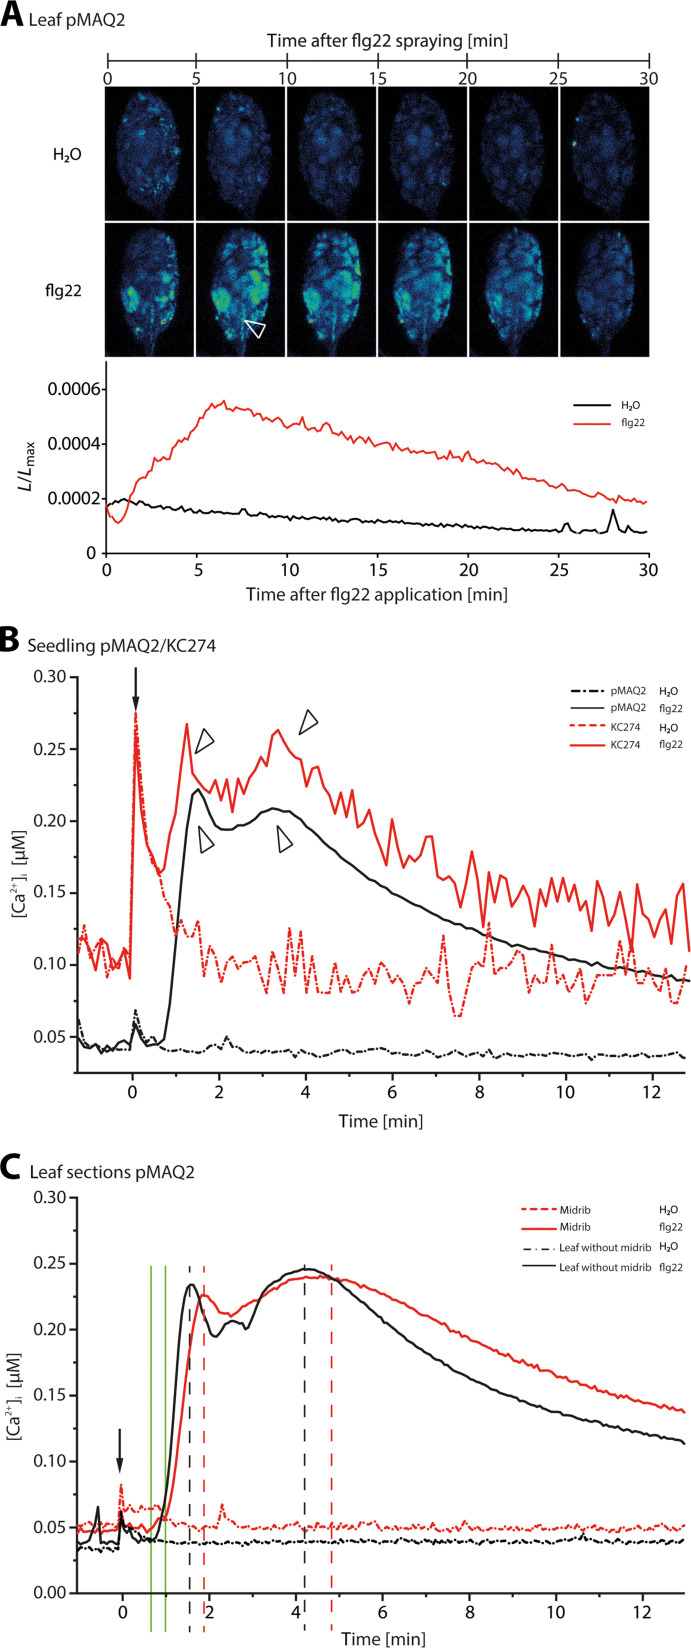
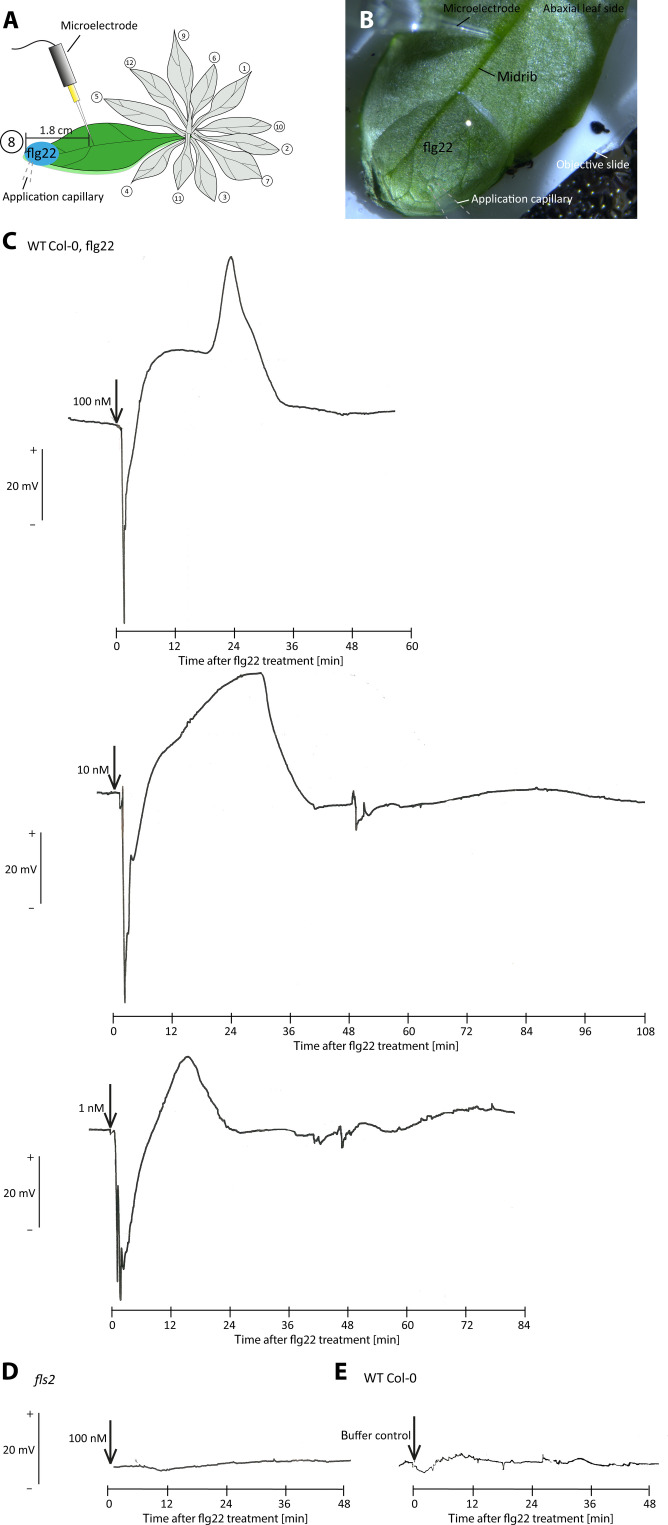
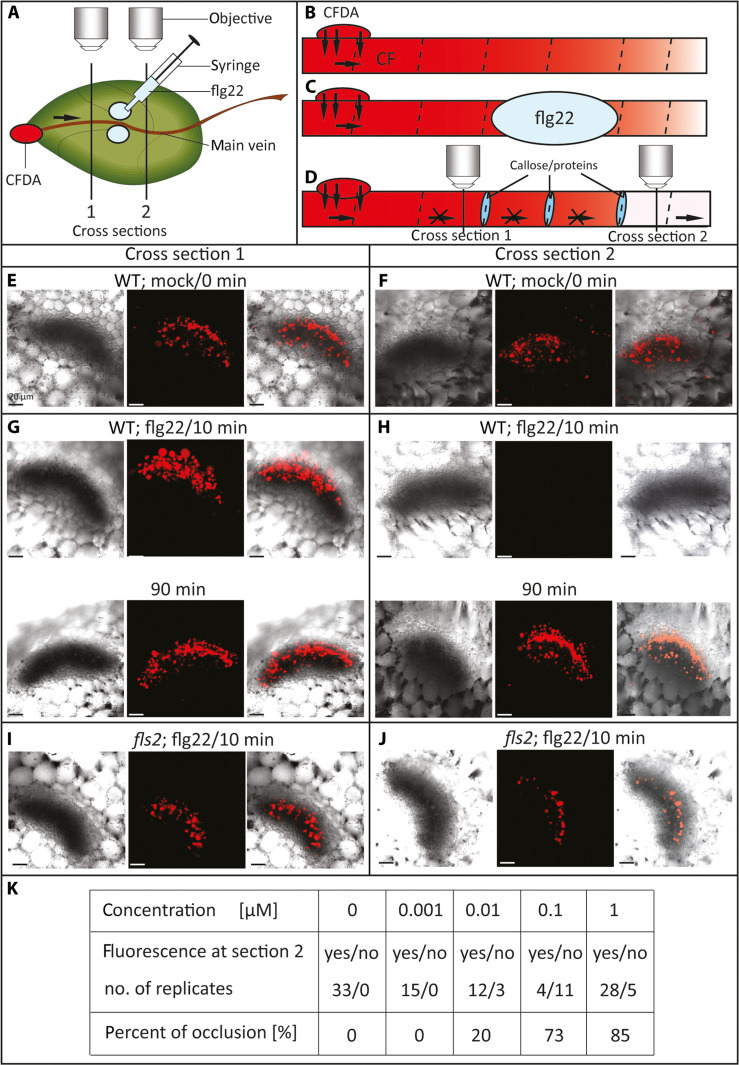
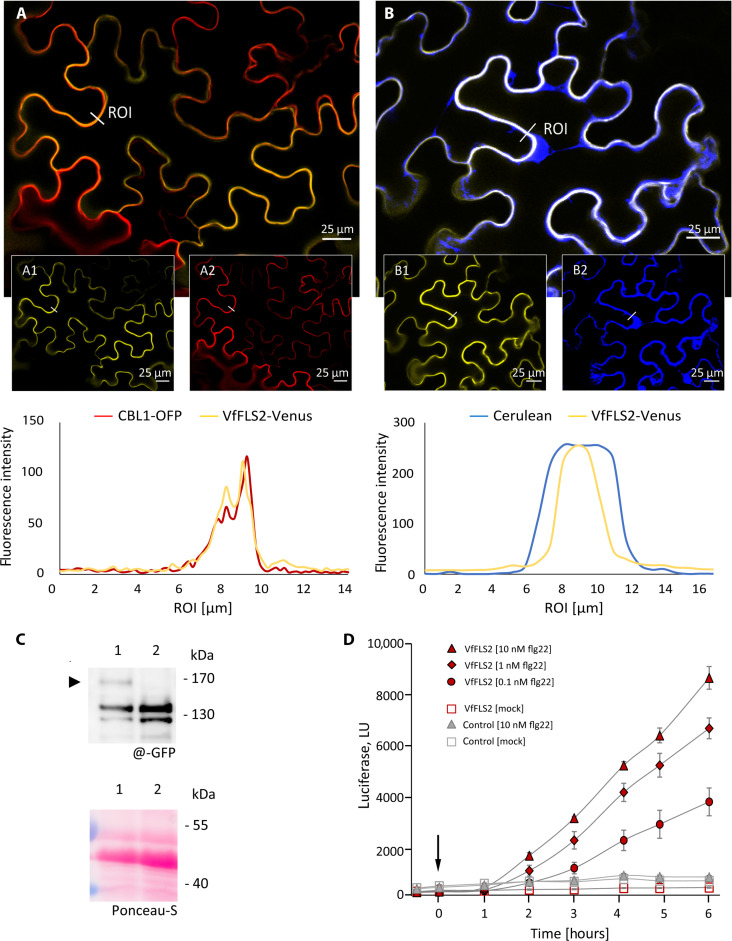
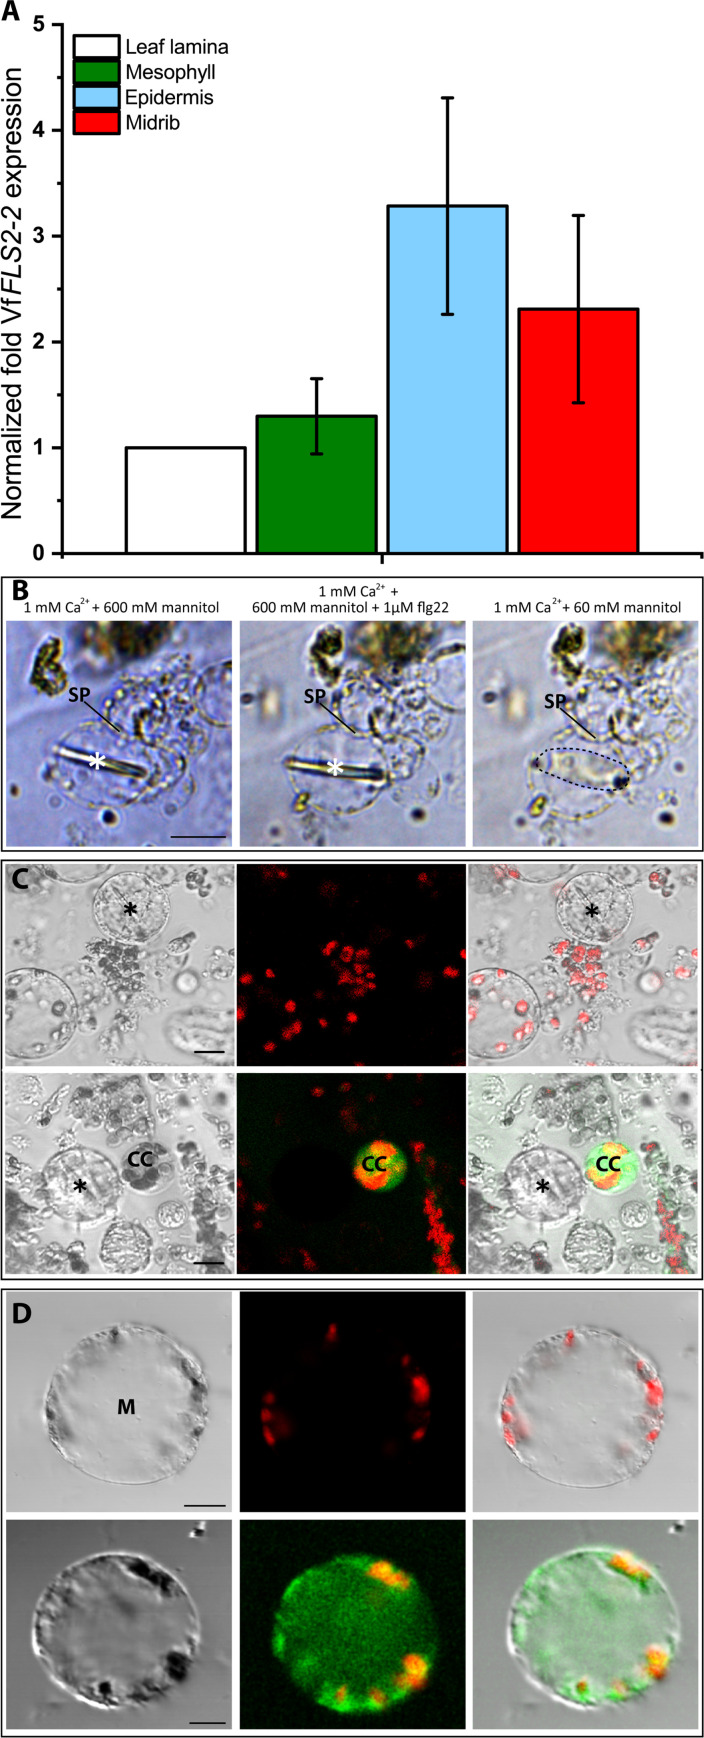
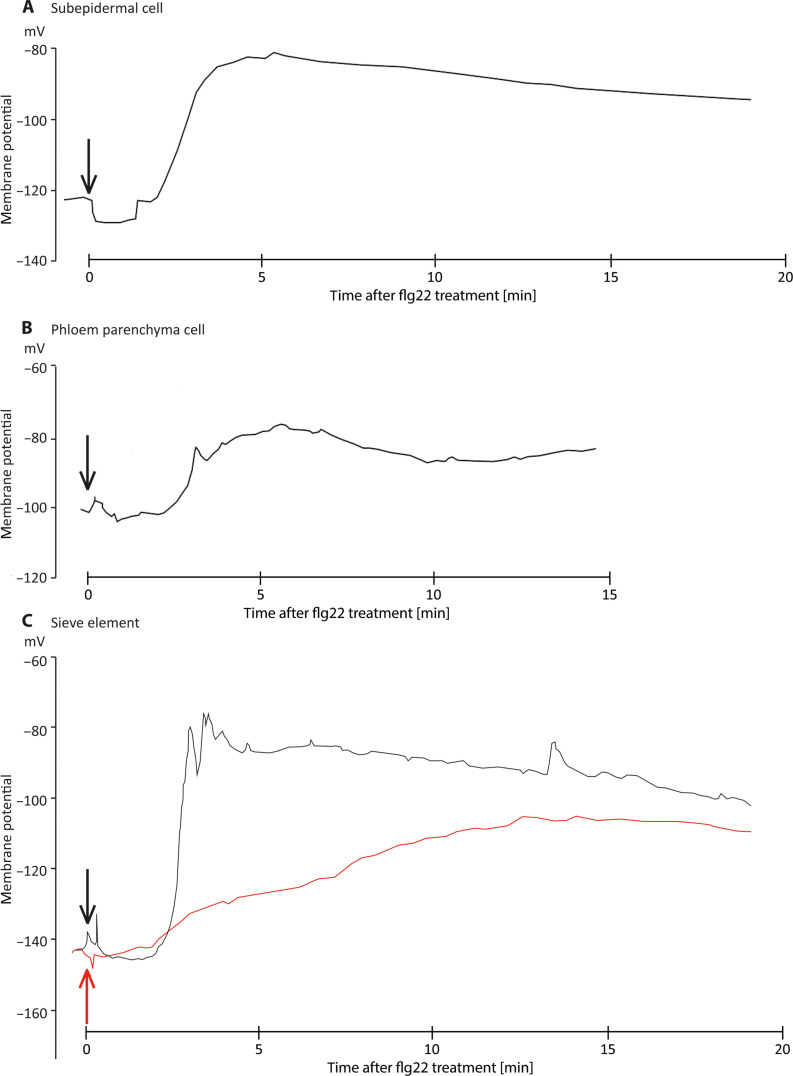
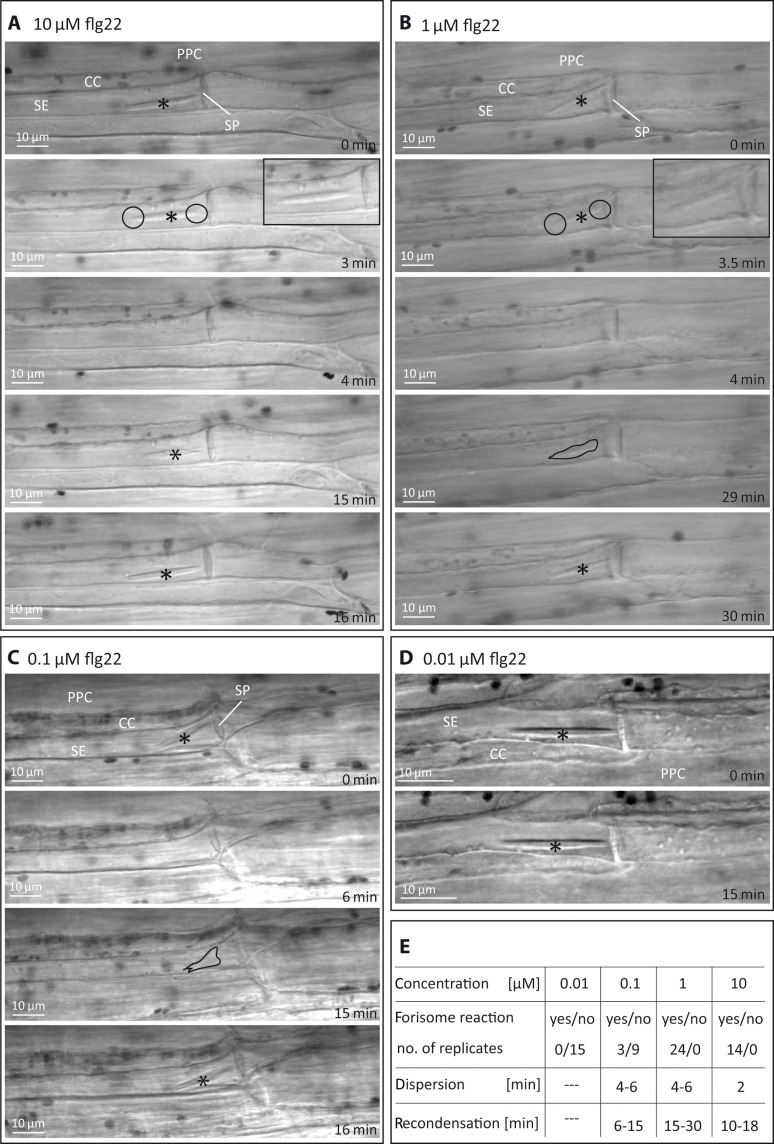
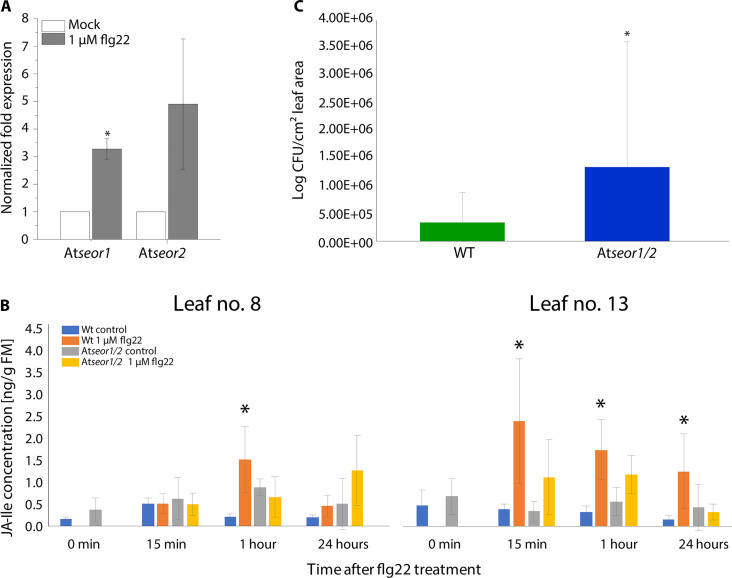
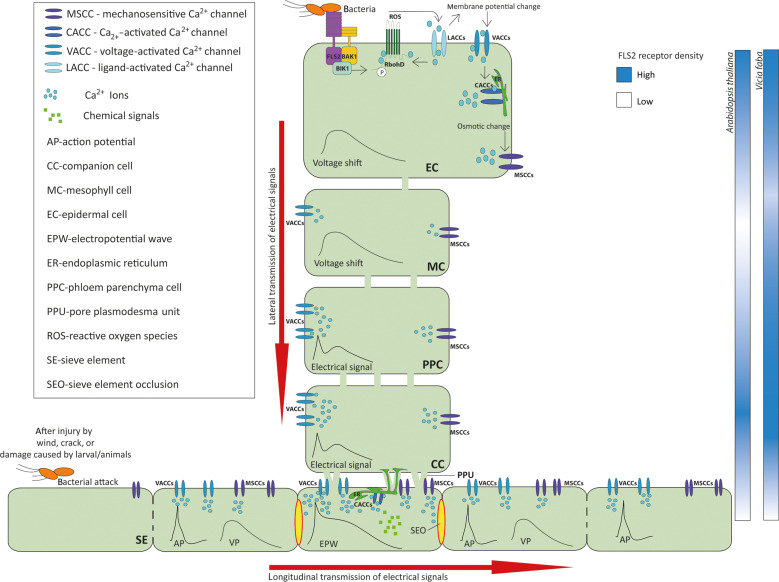
This study focuses on the question how and where information acquired by FLS2 perception of flg22 is transformed into electrical signals crucial for generation of local and systemic defense responses. In Arabidopsis thaliana and Vicia faba leaves, FLS2 density was high in the epidermis and vascular parenchyma, low in mesophyll, and absent in sieve elements (SEs). Aequorin-based examinations disclosed dual cytosolic Ca2+ peaks shortly after flg22 application, which corresponded with two voltage shifts from the epidermis to SEs. These signals were converted into rapid long-range action potentials (APs) or slower short-range variation potentials (VPs). Modified phytohormone-levels demonstrated systemic AP effects. Jasmonic acid up-regulation was significantly higher in wild-type than Atseor1/2 mutants. Abundant Ca2+ influx associated with VPs was responsible for transient sieve element occlusion (SEO) near the flg22 perception site, whereas SEO was absent in Atseor1/2 and Atfls2 mutants. Biological relevance of SEO was demonstrated by higher susceptibility of Atseor1/2 mutants to Pseudomonas syringae than wild-type plants.


Figures

Fig. 1.
Fig. 1.. Cellular deployment of FLS2 receptors in A. thaliana leaf tissues.
(A) Relative expression levels of FLS2 in midrib tissue were significantly (P < 0.05) higher than in the rest of the lamina. The values were normalized to the housekeeping gene (actin), and the whole leaf sample and were defined as 1.0 (n = 4). (B to G) For determination of the intercellular location of FLS2-receptors, pFLS2::FLS2-3xmyc-GFP plants [(C), (E), (F), and (G)] were examined and analyzed by CLSM. Pictures of WT Columbia [(B) and (D)] of leaf epidermis surface (B) and longitudinal minor vein sections (D) were used as controls. In the pFLS2::FLS2-3xmyc-GFP, the epidermis of the abaxial leaf side shows a strong GFP fluorescence at the stomata (C). [(D) to (G)] Longitudinal sections of the midrib and [(F) and (G)] a detail of the vascular bundle including companion cell (CC), sieve element (SE), sieve plate (SP), and phloem parenchyma cells (PPC). In CCs and PPCs, the GFP fluorescence (green) is very strong, whereas cortex cells, the midrib epidermal cells, and notably SEs show less GFP fluorescence. In the detailed pictures of the vascular tissue [(F) and (G)], the localizing signal was enhanced by the use of a GFP antibody in combination with Alexa Fluor 488 secondary antibody. The magenta color represents autofluorescence of chloroplasts, and the gray color represents the thick cell wall material [in (F) and (G) stained with Fluorescent Brightener]. The experiment was repeated with five plants. (H) Quantification of the GFP fluorescence along a line (yellow) of interest (G). a.u., arbitrary units.
Fig. 2.
Fig. 2.. Flg22-induced changes of intracellular Ca2+ [Ca2+]cyt in the entire seedlings, leaves, and vascular and laminar sections of A. thaliana.
(A) An flg22 solution [(1 μM in double-distilled water (H2Odd)] or H2Odd (as a control) was sprayed onto the leaf surface of an intact A. thaliana plant expressing apoaequorin (pMAQ2). The [Ca2+]cyt change was recorded as successive luminescence images of [Ca2+]cyt-dependent photon counts accumulated every 300 s. The [Ca2+]cyt-dependent photon counts are presented as Lmax-normalized values (luminescence counts per s/total luminescence counts remaining). The [Ca2+]cyt increased during the first 5 to 6 min in delimited areas, scattered over the lamina and main vein (marked with a white arrow head; n = 3). (B) The specific [Ca2+]cyt change in the vascular system was further investigated by comparing the response to flg22 application of the pMAQ2 line and the vasculature-limited GAL4 enhancer trap line KC274. The entire seedlings were treated with 1 μM flg22 or water, and the induced Ca2+-dependent luminescence was recorded using a luminometer. After flg22 treatment, both lines showed two successive Ca2+ peaks (marked with arrow heads): The first maximum occurred 1 min after flg22 application followed by a second one, 3 to 4 min later (n = 8). (C) To further discriminate the time-staggered response of the laminar and vascular tissues to flg22, midribs only and leaves from which midribs were excised were analyzed. The time shift of the dual Ca2+ responses in midribs and leaves without the midrib is marked with green vertical lines. Midribs only showed a delayed response as compared to leaves without midribs (peaks are marked with vertical dashed lines; n = 20), which suggests a retarded arrival of the Ca2+ influx response in vascular tissue. The application of flg22 or H2O is marked with an arrow. Both result in peak upon application, which is more pronounced in the KC274 line, likely due to the high sensitivity of the Apoaequorin-expressing vascular cells to mechanical stimulation.
Fig. 3.
Fig. 3.. Extracellular voltage recordings in response to remote epidermal flg22 application onto the A. thaliana midrib.
(A and B) The tip of a microelectrode was pierced blindly into the midrib of the abaxial leaf side and used to detect voltage shifts to remote application of 10 μl of flg22 (1, 10, or 100 nM administered separately to leaves of different plants) dissolved in a bathing medium containing 0.1% Tween 20. The flg22 solutions or a bathing medium (control) were carefully dropped onto the abaxial epidermis. (C) Flg22 induced voltage shifts in A. thaliana WT plants but not in (D) fls2 mutant plants or (E) after a control treatment. Time points of flg22 application are marked with an arrow. Each measurement was repeated at least four times.
Fig. 4.
Fig. 4.. Examination of a transient stop of mass flow in sieve tubes in A. thaliana WT and fls2 leaves after infiltration of flg22.
(A to D) Schematic drawings of the experimental setup and SE reactions. (A) The nonfluorescent ester CFDA (membrane permeable) was continuously applied to cropped leaf tips and trapped in SEs. There, it was cleaved by esterases to form the polar (membrane impermeable) fluorescent CF. Transport of CF was observed by CLSM at cross sections (vertical lines) upstream (1) and downstream (2) the flg22 infiltration site. Control plants (mock) were treated with a bathing medium without flg22. (B) CF was transported by mass flow through sieve tubes. (C) After 2 hours, 100 μl of 1 μM flg22 was pressure infiltrated via a 1-ml syringe, 0.5 cm right and left of the midrib in leaf (D). At different time points after flg22 infiltration, CF fluorescence in the phloem was examined in cross sections upstream (E, G, and I) and downstream (F, H, and J) the infiltration site. SEO is marked by blue ovals (D). [(E) and (F)] In mock-treated plants, CF fluorescence was always detected at both sides, upstream and downstream the infiltration site (fig. S2). [(G) and (H)] Ten minutes after flg22 treatment, no CF fluorescence was observed downstream the flg22 infiltration site of WT plants, indicative of SEO. Ninety minutes after flg22 infiltration, CF fluorescence was detected again in both cross sections, which disclosed lifting of SE blockage and resumption of phloem transport. [(I) and (J)] In the fls2 mutant, CF fluorescence was always detected upstream and downstream of the flg22 infiltration site, showing undisturbed mass flow due to compromised perception of flg22 (exemplarily shown for 10 min after flg22 infiltration; n = 5). Transmission channel, 488-nm line, and merged image are presented from left to right [(E) to (J)]. (K) Summary of SEO induced with different flg22 concentrations.
Fig. 5.
Fig. 5.. Presence, location, and functional characterization of VfFLS2.
Subcellular localization of V. faba VfFLS2 in epidermis cells was determined via infiltration of the VfFLS2 sequence by A. tumefaciens in N. benthamiana leaves. The VfFLS2-Venus fusion protein (yellow) coexpressed with (A) a plasma-membrane located CBL1-OFP (red) revealed their colocalization. (B) Coexpression with cytoplasmatic Cerulean (blue) showed no colocalization with FLS2. The smaller pictures show the individual localization of the VfFLS2-Venus fusion protein [(A1) and (B1)] and the subcellular markers [(A2) and (B2)]. The subcellular distribution of yellow, red, and blue fluorescence was analyzed by performing a virtual line scan across a region of interest (ROI). Scale bars, 25 μm. (C) Western blot (top) developed with antibodies against the fluorophore tag at the C terminus of VfFLS2 indicates a protein (arrowhead) of the expected molecular mass in cotransformed protoplasts (lane 1) and not in protoplasts transformed with the reporter only (lane 2). The Ponceau-S–stained membrane is shown in the bottom to monitor similar protein loading. (D) Functionality of VfFLS2 was tested in mesophyll protoplasts of A. thaliana lacking FLS2 (efr x fls2 mutant), cotransformed with pFRK1::luciferase, in comparison to the control transformation with the reporter gene only. Treatment of VfFLS2-expressing cells with flg22 in increasing concentrations (0.1 to 10 nM) at 0 hours (arrow) resulted in a dose-dependent increase in luciferase activity [light units (LU)] over time, confirming the capacity of VfFLS to perceive flg22 with high sensitivity and to transduce the peptide signal into a cellular response. Values and error bars indicate mean and SD of three replicates.
Fig. 6.
Fig. 6.. VfFLS2 receptor density in vascular cell types of V. faba.
(A) The VfFLS2 expression pattern in V. faba was analyzed by RT-qPCR. A tendentially higher amount of VfFLS2 transcripts was found in the midrib and epidermal tissue as compared to the remainder of the leaf lamina. Each bar represents the mean of three technical replicates from five different plants ± SE. (B) The presence of FLS2 receptors in V. faba SE was analyzed using SE protoplasts that can be easily identified by the presence of a forisome. SE protoplasts [so-called twin protoplasts separated by a sieve plate (SP); (35)] were incubated in a medium containing 1 mM Ca2+ and 600 mM mannitol. Forisomes (asterisks) were in the condensed state and remained condensed after adding 1 μM flg22. The lacking forisome reaction to flg22 indicated an absence of FLS2 in SEs. Forisome functionality was demonstrated by subsequent perfusion of a hypoosmotic solution (1 mM Ca2+ and 60 mM mannitol). As a response, the protoplasts expanded and the forisomes dispersed (dashed line). Number of replicates n = 14. (C and D) Sensitivity for flg22 of non-SE phloem-derived protoplasts was visualized by accumulation of ROS. To that aim, 10 μM H2DCFDA was applied to the protoplast batch. Control protoplasts (top rows) without flg22 application showed red autofluorescence of chloroplasts in mesophyll protoplasts (M), which was absent in the larger SE protoplasts marked by a forisome (asterisks). After application of 1 μM flg22, companion cell (CC) protoplasts (C) and subepidermal/mesophyll protoplasts (D) showed a green ROS-dependent H2DCFDA fluorescence signal in contrast to the SE protoplasts (C) (n = 6) after 10 min. Transmission channel image (left), 488-nm excitation image (middle), and merged image (right). Scale bars, 10 μm
Fig. 7.
Fig. 7.. Membrane potential recordings of various cell types in V. faba midribs of intact leaves in response to flg22 application.
The cell-specific electrophysiological response to flg22 (1 μM) was investigated through intracellular recordings in different cell types. (A) Subepidermal cell, (B) phloem parenchyma cell, and (C) SE. For each cell type, a depolarization was detected in response to flg22 application (black traces) but the strongest reaction was found for SEs (~65 mV). Addition of the Ca2+ channel blocker La3+ (100 μM) resulted in a strongly reduced depolarization with a flattened profile in SEs (red trace), suggesting a Ca2+ involvement in the flg22-induced electrical response. The time point of flg22 application is marked with an arrow. n = 3.
Fig. 8.
Fig. 8.. Forisome dispersion in intact SEs in the main vein of V. faba leaves in response to flg22 application.
Forisome dispersion and recondensation in sieve tubes were monitored by successive light microscopic observations in response to local treatments with (A) 10 μM, (B) 1 μM, (C) 0.1 μM, or (D) 0.01 μM flg22 applied to individual plants. Dispersed forisomes became invisible due to a change in optical properties. [(A) and (B)] Dispersion of forisomes started at the ends (circles), subsequent to or concurrent with presumptive detachment (, 40) from the plasma membrane. Insets show a slight position change of forisomes 3 min after treatment. [(B) and (C)] Recondensation of forisomes occurred gradually. Intermediate stages are outlined in black. (D) Treatment with 0.01 μM flg22 appears to be below the threshold level required to induce forisome dispersion, whereas 1 and 10 μM are clearly above the threshold. Asterisks mark forisomes in the condensed state. SE, sieve element; SP, sieve plate; CC, companion cell; PPC, phloem parenchyma cell. (E) Summary of observed forisome reactions; [min] represents the time lapse after flg22 application.
Fig. 9.
Fig. 9.. Assays related to flg22-induced suppression of Pseudomonas growth in A. thaliana WT (Col-0) and Atseor1/2 mutant plants.
(A) Relative expression levels of AtSEOR1 and AtSEOR2 genes after 1 μM flg22 treatment of the whole plant. Values were normalized to the housekeeping gene (Actin2) and the untreated control (n = 4). (B) JA-Ile determination in A. thaliana WT and Atseor1/2 double knockout plants in response to 1 μM flg22 application to leaf 8. Leaves 8 and 13 were harvested at various time points and analyzed individually with LC-MS/MS (n = 6 biological replicates). For all experiments, the bars represent the mean and SE of the biological replicates. The asterisks indicate statistical significance (P < 0.05) between the control and treatment based on Student’s t test. (C) P. syringae infection level in A. thaliana leaves 3 days after infection. Leaves of WT (Col-0) (green) and the Atseor1/2 mutant line (blue) were infiltrated with P. syringae pv. tomato DC3000. Three days after the infiltration, bacteria were isolated and a dilution series is dripped out on agar plates. The infection level (log CFU/cm2) was determined by colony counting. The asterisk indicates statistical significance (P < 0.05) between WT and Atseor1/2 mutant line based on Mann-Whitney test. WT, n = 40; Atseor1/2, n = 39.
Fig. 10.
Fig. 10.. SEO effected by VPs triggered by flg22 application.
Bacterial flg22 is sensed by aggregates of FLS2 receptors located in the plasma membrane of epidermal and subepidermal cells [cf. (14)] but also in that of the phloem parenchyma cells and companion cells (Fig. 1), whereas the SE plasma membrane is devoid of FLS2 receptors (Figs. 1 and 6). In FLS2-rich cells, flg22 binding induces a Ca2+ influx from the apoplast into the cell interior via Ca2+-permeable channels (see fig. S10). The resulting intracellular rise of Ca2+ triggers a depolarization of the plasma membrane and ROS production (26). The dual voltage response probably initiates trafficking of two successive overlapping voltage shifts via the plasmodesmata, giving rise to APs and VPs propagating via the SEs. The amount of Ca2+ released into SEs by VPs affects forisomes, giant protein bodies in legume SEs, which act as sieve tube plugs after wounding or pathogenic attacks (, 21). Swelling or dispersion of forisomes is Ca2+ dose dependent, and hence, they may react to the Ca2+ elevation during EPW passage in SEs. Thus, the forisome reaction serves as an indicator for massive Ca2+ influx. Forisomes are insensitive to APs (33), which demonstrates that Ca2+ influx mediated by APs falls short to meet the dispersion threshold and that only VP-mediated Ca2+ influx exceeds the dispersion threshold. VPs provoke a transient closure of SEs and, probably, the plasmodesmal connectivity of nearby vascular cells. In this way, a temporary insulation of the area in question is reached, which may contribute to mounting defense mechanisms.

Similar articles

Cited by

References

    1. Boller T., Felix G., A renaissance of elicitors: Perception of microbe-associated molecular pattern and danger signals by pattern-recognition receptors. Annu. Rev. Plant Biol. 60, 379–406 (2009). - PubMed
    1. Ranf S., Eschen-Lippold L., Pecher P., Lee J., Scheel D., Interplay between calcium signalling and early signalling elements during defence responses to microbe- or damage-associated molecular patterns. Plant J. 68, 100–113 (2011). - PubMed
    1. Erickson J., Weckwerth P. R., Romeis T., Lee J., What’s new in protein kinase/phosphatase signaling in the control of plant immunity? Essays Biochem. 66, 621–634 (2022). - PMC - PubMed
    1. Zhang J., Zhou J.-M., Plant immunity triggered by microbial molecular signatures. Mol. Plant 3, 783–793 (2010). - PubMed
    1. Melnyk C. W., Molnar A., Baulcombe D. C., Intercellular and systemic movement of RNA silencing signals. EMBO J. 30, 3553–3563 (2011). - PMC - PubMed

MeSH terms

LinkOut - more resources