. 2025 Feb 28;11(9):eadr1481.
doi: 10.1126/sciadv.adr1481. Epub 2025 Feb 26.

Modulation of blood-tumor barrier transcriptional programs improves intratumoral drug delivery and potentiates chemotherapy in GBM

Affiliations

Modulation of blood-tumor barrier transcriptional programs improves intratumoral drug delivery and potentiates chemotherapy in GBM

Jorge L Jimenez-Macias et al. Sci Adv. .

Abstract

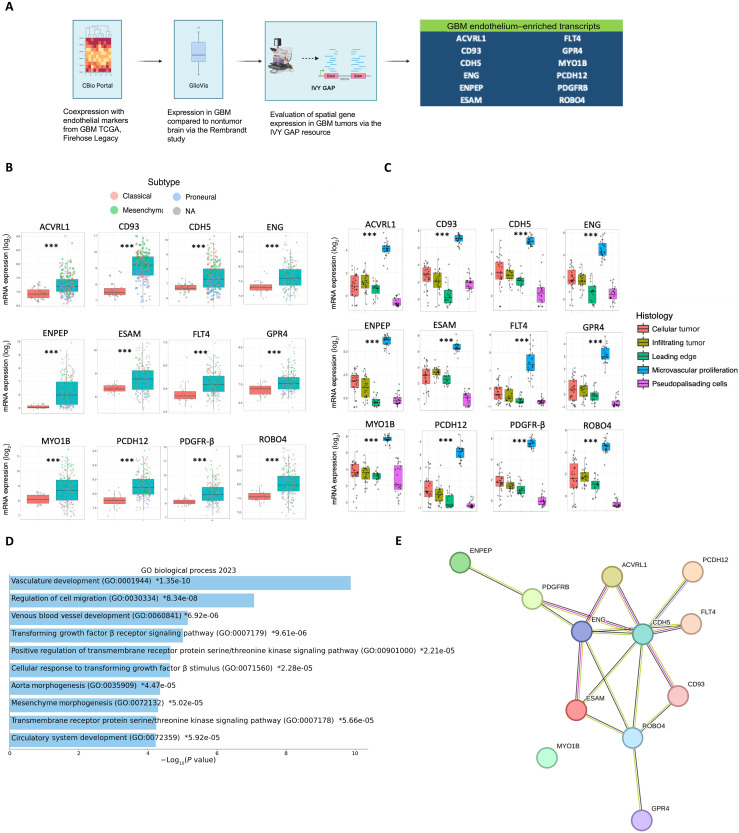
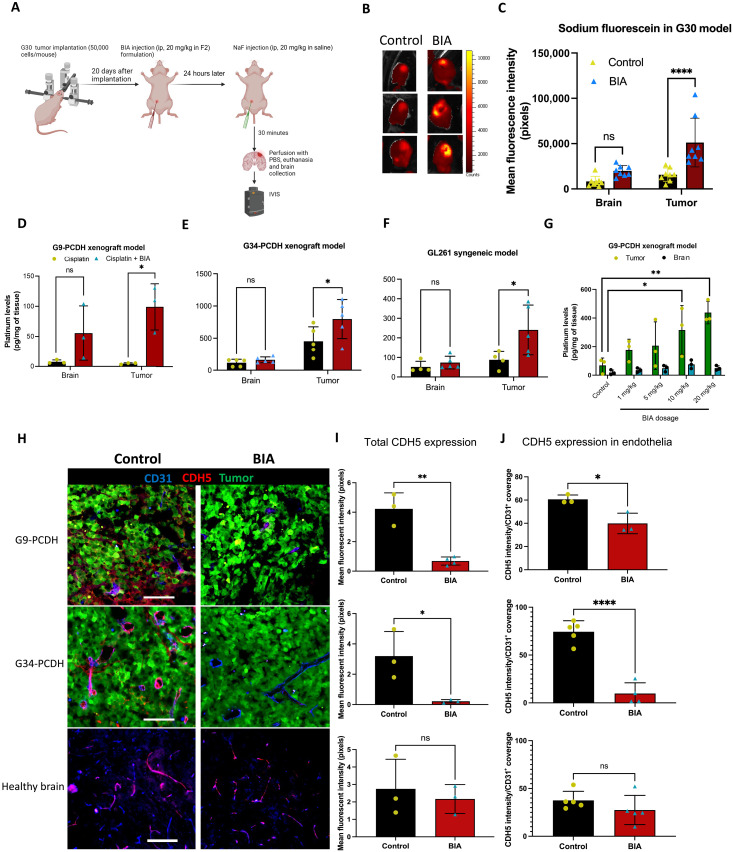
Efficient drug delivery to glioblastoma (GBM) is a major obstacle as the blood-brain barrier (BBB) and the blood-tumor barrier (BTB) prevent passage of the majority of chemotherapies into the brain. Here, we identified a transcriptional 12-gene signature associated with the BTB in GBM. We identified CDH5 as a core molecule in this set and confirmed its expression in GBM vasculature using transcriptomics and immunostaining of patient specimens. The indirubin-derivative, 6-bromoindirubin acetoxime (BIA), down-regulates CDH5 and other BTB signature genes, causing endothelial barrier disruption in vitro and in murine GBM xenograft models. Treatment with BIA increased intratumoral cisplatin accumulation and potentiated DNA damage by targeting DNA repair pathways. Last, using an injectable BIA nanoparticle formulation, PPRX-1701, we significantly improved cisplatin efficacy in murine GBM. Our work reveals potential targets of the BTB and the bifunctional properties of BIA as a BTB modulator and a potentiator of chemotherapy, supporting its further development.


Figures

Fig. 1.
Fig. 1.. Identification of tumor-endothelium associated (BTB genes) using bulk RNA-seq datasets from GBM clinical samples.
(A) Workflow of identification and filtering of genes associated with tumoral vasculature in GBM. Using a gene expression correlation tool, cBio, top 50 genes that coexpressed with CD31, VWF, CD34, and CLEC14A were selected, confirmed their overexpression in tumor above normal brain in the Rembrandt dataset using GlioVis visualization tool, and evaluated regional expression using the IVY GAP atlas resource. Panel figure was generated using Biorender.com. (B) Gene expression of 12 GBM endothelium–enriched transcripts identified in the cBio Portal following the workflow shown in (A) ***P < 0.001 by Tukey’s post hoc test. Individual values are colored by GBM subtypes classical, mesenchymal, or proneural. NA indicates unknown sample information. (C) Regional expression of the 12 BTB genes in GBM using the IVY GAP resource. ***P < 0.001 by Tukey’s post hoc test. (D) Gene ontology analysis (GO Biological Process 2023) of the 12 BTB genes using the EnrichR software. Biological processes are ranked by P values, which are indicated next to the GO designation. (E) STRING network analysis on the 13 identified BTB genes; 12 nodes, 17 edges, average node degree of 2.83. PPI enrichment P value, 1 × 10⁻¹⁶.
Fig. 2.
Fig. 2.. Spatial transcriptomic analysis of GBM patient samples confirms CDH5 up-regulation in tumor-associated endothelium.
(A) Surface plots of CDH5 expression from spatial transcriptomic performed on UKF_248 GBM tumor and nontumorigenic cortex tissues. (B) Spatial Uniform Manifold Approximation and Projection (UMAP) clustering plot in cortex (left) and tumor (right) for UKF_248. (C) Violin plots indicating endothelial cell marker expression and CDH5 from UKF_248 tissues and clustered according to spatial clustering from (B). (D) GO indicating associated pathways with CDH5 gene expression in cluster 3 of sample UKF_248. GO biological processes highlighted in red indicate vasculature development and regulation of angiogenesis as pathways enriched for CDH5. Top 20 gene list for highlighted GO pathways is shown. Data were obtained and reanalyzed from (20) using the SPATA2 package from R-studio.
Fig. 3.
Fig. 3.. BIA modulates BTB-associated genes and cell motility, vascular development, angiogenesis, and l-serine metabolism in brain endothelial cells.
(A) Heatmap generated from the top 15 up-regulated and down-regulated genes (log2FC) from bulk RNA-seq analysis performed on HCMEC/D3 cells treated with BIA (1 μM, 24 hours). (B) GO analysis of >1.5 (log2FC) significantly up-regulated and down-regulated genes by BIA in brain endothelial cells from (A). Biological processes are ranked by P values, which are shown next to the GO designation. Analysis performed using the EnrichR software. (C) Volcano plot analysis from all the up-regulated and down-regulated genes by BIA. Labels on genes related to angiogenesis, TGF-β, and WNT pathways are highlighted. (D) Gene expression fold change (log2) levels of dysregulated genes by BIA related to the TGF-β and WNT pathways, angiogenesis, and the tumor vascular associated genes (BTB genes, highlighted). (E) Spatial expression of 7 of the 12 BTB genes regulated by BIA in vitro highlighted in (D) for nontumor (left) and tumor (right) tissues from sample UKF_248. (F) Clustered gene expression of UKF_248 showing the BTB genes from (E) in nontumor (left) and tumor tissue (right).
Fig. 4.
Fig. 4.. BIA prevents barrier formation by brain endothelial cells in vitro and increases dextran uptake in a three-dimensional BBB spheroid model.
(A) IF staining of CDH5 (red) and nuclei (blue) in HCMEC/D3 cells treated with BIA (1 μM, 24 hours). Scale bar, 20 μm. (B) TEER values of HCMEC/D3 treated with BIA upon monolayer confluence. Time point of BIA addition is indicated. (C) Interference RNA depletion of CDH5 in HCMEC/D3 cells and TEER values of these cells upon ECIS measurement. Western blot for CDH5 depletion confirmation is shown. β-Actin was used as a loading control. (D) IF images of BBB spheroids treated with indicated doses of BIA for 72 hours. Staining of F-actin (green), CDH5 (red), and nuclei (blue). Maximal projection intensity is shown from z-stack images (50 μm depth, 20 layers). Scale bar, 100 μm. (E) FITC-conjugated dextran (70 kDa) permeability assay in BBB spheroids. Dextran (gray) and nuclei (purple) are shown. Scale bar, 100 μm. Mean fluorescence quantification of (F) CDH5, (G) Phalloidin and (H) FITC-dextran from images in (D) and (E) using the ImageJ software. A.F., Alexa Fluor. Data show mean and SD, n = 4 to 5. Ordinary one-way analysis of variance (ANOVA) test. *P = 0.018, **P = 0.0028, ***P = 0.008, and ****P < 0.0001. (I) Human phospho-kinase array of HCMEC/D3 cells exposed to 1 μM BIA for 24 hours. Highlighted wells related to indicated pathways. Samples were analyzed in duplicates. (J) Quantification of signal by ImageJ of dot blot shown in (I). Mean and SD of duplicates are shown. Two-way ANOVA analysis was performed. **P = 0.0015, ***P = 0.005, and ****P < 0.0001.
Fig. 5.
Fig. 5.. Systemic administration of BIA increases the selective uptake of sodium fluorescein and platinum chemotherapy in GBM murine tumors.
(A) Workflow schematic of BIA administration and subsequent injection of Sodium Fluorescein (NaF) for BTB permeability assessment. Panel figure was generated using Biorender.com. (B) In vivo imaging system (IVIS) pictures of G30 tumor–bearing brains from mice injected with BIA and NaF as shown in (A). (C) Quantification of image intensity was performed with ImageJ (Fiji). Mean and SD are shown, n = 7 to 8. Unpaired t test for statistical significance, ****P = 0.0024. (D) Platinum quantification via ICP-MS of brain and tumor tissue from tumor-bearing mice injected with cisplatin in G9-PCDH, (E) G34-PCDH, and (F) GL-261 murine models. Cisplatin (5 mg/kg) was administered 24 hours after BIA injection. Mean and SD are shown, n = 3 to 5 per group. Two-way ANOVA statistical analysis was performed, *P < 0.05. (G) Platinum quantification via ICP-MS of tumor and brain tissue of a G9-PCDH tumor–bearing xenograft model administered with increasing BIA doses. Mean and SD are shown, n = 3 per group. Two-way ANOVA test, *P = 0.0177 and **P = 0.0016. (H) Confocal IF imaging from frozen and sectioned brain tissue from G9-PCDH and G34-PCDH xenograft murine models, 24 hours after injection with BIA (20 mg/kg). CDH5 was stained in tumor and healthy brain tissue with Alexa Fluor 594 and blood vessels with anti-CD31 and Alexa Fluor 405. GBM cells are prelabeled with GFP. Images shown at 20×, with scale bars at 100 μm, accordingly. (I) Total CDH5 fluorescence quantification (Alexa Fluor 594) and (J) CDH5 coverage in CD31+ vessels from experiment in (E) using ImageJ (Fiji). Mean and SD are shown. Unpaired t test (n = 3 per group). ****P < 0.0001, **P = 0.0013, and *P = 0.0334. ns, not significant.
Fig. 6.
Fig. 6.. BIA potentiates platinum-based cytotoxicity by targeting DNA repair pathways in patient-derived GBM cells.
(A) GBM cell viability assay (ATP-based) using Cell-Titer Glo 3D of BIA and cisplatin combination treatment. Cisplatin doses are indicated in the x axis, and BIA remained at a constant concentration of 1 μM. Cells were treated for 5 days and analyzed using a plate reader for luminescence quantification. Mean and SD are shown, n = 3 per group. (B) Dose-response matrix showing inhibition percentage of BIA and cisplatin combinations at various concentrations using SynergyFinder 3.0. G9-PCDH cells were treated and viability analyzed as indicated in the cell viability assay section (see Materials and Methods). (C) ZIP method synergy score of BIA and cisplatin combinations. The overall average δ-score is indicated on top of the chart. The dose combinations showing an increased likelihood of synergy are highlighted. (D) IF staining of γH2AX (Alexa Fluor 647) in G9-PCDH cells treated with 1 μM cisplatin and/or BIA, for 72 hours. Nuclei were stained using Hoechst 33342. Representative image of five pictures per condition. Pictures taken at 40×. Scale bar, 20 μm. (E) Quantification of γH2AX foci from (B) using ImageJ. (F) Western blot of G9-PCDH cells treated with 1 μM cisplatin and/or BIA, for 72 hours, probing for the phospho-CHK1, CHK1, and phospho-H2AX proteins. GAPDH was used as loading control and cleaved poly(adenosine diphosphate–ribose) polymerase as a cell death marker. Representative image from triplicate experiments. *P = 0.028, **P < 0.01, ***P < 0.001, and ****P < 0.0001.
Fig. 7.
Fig. 7.. Systemic administration of BIA or PPRX-1701 in combination with cisplatin treatment shows enhanced preclinical efficacy in murine GBM models.
(A and C) Diagrams of the experimental design for G34-PCDH and G9-PCDH xenograft efficacy studies using BIA/PPRX-1701 and cisplatin combinations. Both panel figures were generated using Biorender.com. (B) Efficacy studies of G34-PCDH xenograft using BIA and (D) PPRX-1701 in combination with cisplatin. For PPRX-1701 studies, empty nanoparticles were used as controls and in combination with cisplatin. N = 8 per group. Log-rank test analysis for statistical significance. (E) Confocal IF imaging of γH2AX (Alexa Fluor 647, red) nuclear foci from tumor tissue collected from study (D). Nuclei were stained with Hoechst 33342 (blue). Representative pictures taken at 20×. Scale bar, 50 μm. (F) Quantification of γH2AX foci from (E) using ImageJ, n = 6 per group. Ordinary One-way ANOVA was performed for statistical evaluation. *P = 0.01 and **P = 0.0086. (G) Schematic of proposed model of BIA/PPRX-1701 mechanism of action and its effects in GBM tumor drug delivery and antioncogenicity. Figure panel was generated using Biorender.com.

Update of

References

    1. Ostrom Q. T., Cioffi G., Gittleman H., Patil N., Waite K., Kruchko C., Barnholtz-Sloan J. S., CBTRUS statistical report: Primary brain and other central nervous system tumors diagnosed in the United States in 2012-2016. Neuro Oncol. 21 ( Suppl. 5), V1–V100 (2019). - PMC - PubMed
    1. Grochans S., Cybulska A. M., Simińska D., Korbecki J., Kojder K., Chlubek D., Baranowska-Bosiacka I., Epidemiology of glioblastoma multiforme–literature review. Cancers 14, 2412 (2022). - PMC - PubMed
    1. Sweeney M. D., Zhao Z., Montagne A., Nelson A. R., Zlokovic B. V., Blood-brain barrier: From physiology to disease and back. Physiol. Rev. 99, 21–78 (2018). - PMC - PubMed
    1. Steeg P. S., The blood–tumour barrier in cancer biology and therapy. Nat. Rev. Clin. Oncol. 18, 696–714 (2021). - PubMed
    1. Arvanitis C. D., Ferraro G. B., Jain R. K., The blood–brain barrier and blood–tumour barrier in brain tumours and metastases. Nat. Rev. Cancer 20, 26–41 (2020). - PMC - PubMed

MeSH terms