. 2025 May 2;85(9):1596-1610.
doi: 10.1158/0008-5472.CAN-24-3833.

CXCL10 Secreted by Pericytes Mediates TNFα-Induced Vascular Leakage in Tumors and Enhances Extravasation of Nanoparticle-Based Chemotherapeutics

Affiliations

CXCL10 Secreted by Pericytes Mediates TNFα-Induced Vascular Leakage in Tumors and Enhances Extravasation of Nanoparticle-Based Chemotherapeutics

Ann L B Seynhaeve et al. Cancer Res. .

Abstract

TNFα induces vascular permeability and plays an important role in inflammation. In addition, TNFα-induced vascular leakage is involved in the increased extravasation of nanoparticle-formulated chemotherapeutic drugs, improving drug delivery and subsequent tumor response. In this study, we uncovered a positive correlation between the presence of pericytes in the tumor-associated vasculature and TNFα-induced leakage and drug delivery, especially when drugs were encapsulated in nanoparticles. RNA sequencing and pathway analysis identified high expression of C-X-C motif chemokine ligand 10 (CXCL10) in TNFα-stimulated pericytes. In addition, TNFα increased CXCL10 protein production by pericytes in vitro. In animal studies, tumor types with vessels with high pericyte coverage showed enhanced permeability and extravasation of drugs encapsulated in nanoparticles following treatment with TNFα, which could be blocked with a CXCL10-neutralizing antibody. In contrast, tumors harboring vessels with low pericyte numbers did not display increased drug extravasation in response to TNFα. Lack of pericyte coverage could be compensated by coadministration of CXCL10. These findings reveal a mechanism by which TNFα induces CXCL10 release from pericytes, resulting in increased endothelial permeability, vascular leakage, and drug delivery. Significance: TNFα stimulates tumor-associated pericytes to produce CXCL10 that mediates vascular leakage and assists in the intratumoral delivery of nanoparticle-encapsulated chemotherapeutic drugs.


Conflict of interest statement

A.L.B. Seynhaeve reports grants and personal fees from the Dutch Cancer Society and grants and other support from Vereniging Trustfonds Erasmus University Rotterdam and Stichting Erasmus Heelkundig Kankeronderzoek during the conduct of the study. No disclosures were reported by the other authors.

Figures
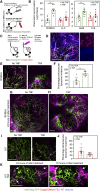
Figure 1.
Figure 1.
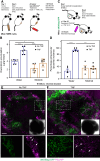
TNF induces vascular leakage in tumors having vessels with high pericyte coverage. A, Experimental procedure to analyze intratumoral doxorubicin accumulation in tumors after treatment with doxil with or without TNF. B, Quantification of intratumoral doxorubicin accumulation in high–pericyte coverage B16BL6 and BLM and low–pericyte coverage LLC and 1F6 tumors dissected 12 hours after treatment with doxil or doxil in combination with TNF. Data are shown as the mean ± SEM of at least two measurements from eight mice, Mann–Whitney U test. C, Intravital experimental procedure to analyze vessel leakage and extravasation of PEG-NPs with or without TNF in B16BL6 and LLC tumors. eNOStag-GFP, green fluorescent endothelial cells; Cspg4-DsRed, red fluorescent pericytes; I.V., intravenous injection. D, Representative intravital image of a B16BL6 tumor 24 hours after treatment with nanoparticles (purple) and Hoechst (blue) without TNF. E, Representative intravital images of B16BL6 tumors 24 hours after treatment with nanoparticles with or without TNF. F, Quantification of extravascular nanoparticle incidence, represented in E, in B16BL6 tumors 24 hours after treatment. Data are shown as the mean ± SEM of at least three images from eight mice, Mann–Whitney U test. G and H, Representative intravital images of B16BL6 tumors 24 hours after treatment with PEG-NPs with or without TNF. Asterisk, increased leakage at the tumor–host interface. I, Representative intravital images of LLC tumors 24 hours after treatment with nanoparticles with or without TNF. J, Quantification of extravascular nanoparticle incidence, represented in I, in LLC tumors 24 hours after treatment. Data are shown as the mean ± SEM of at least three images from eight mice. Mann–Whitney U test; not significant. K, Representative intravital images of a LLC tumor 24 and 72 hours after treatment with nanoparticles and TNF. Arrow, increased leakage at certain parts of the tumor. Asterisk, tumor area completely void of nanoparticles. Scale bar, 500 μm for all images. D and E (no TNF), G and E (TNF), H and I (TNF), and K (24 hours) represent the same tumor with different pseudocoloring and/or magnification. **, P < 0.01. See also Supplementary Fig. S1–S6 and Supplementary Table S1.
Figure 2.
Figure 2.
TNF-induced vascular leakage results in an improved tumor response in high–pericyte coverage tumors but not in low–pericyte coverage tumors. A, Experimental procedure to measure tumor response in tumor-bearing animals. I.V., intravenous injection; S.C., subcutaneous injection. B, Tumor growth, expressed as fold change tumor volume, in tumors treated with doxil and doxil in combination with TNF. Arrow, treatment day. Data are shown as the mean ± SD from eight mice. Two-way ANOVA with the Tukey multiple comparisons test; ***, P < 0.001; ****, P < 0.0001. See also Table 1 and Supplementary Fig. S7.
Figure 3.
Figure 3.
TNF-induced leakage and extravasation is lost with the reduction of pericyte coverage. A, Experimental procedure to analyze intratumoral doxorubicin accumulation in high–pericyte coverage BLM tumors dissected from water (control) and nilotinib (loss-of-function) pre-administered animals after treatment with doxil with or without TNF. I.V., intravenous injection; P.O., per oral administration; S.C., subcutaneous injection. B, Quantification of intratumoral doxorubicin accumulation in high–pericyte coverage BLM tumors dissected from water- or nilotinib-administered animals 12 hours after treatment with doxil or doxil in combination with TNF. Data are shown as the mean ± SEM of at least two measurements from six mice. One-way ANOVA with the Tukey multiple comparisons test. C, Intravital experimental procedure to analyze vessel leakage and extravasation of PEG-NPs with or without TNF in water- and nilotinib-administered animals with a high–pericyte coverage B16BL6 tumors. eNOStag-GFP, green fluorescent endothelial cells. D, Quantification of extravascular nanoparticle incidence in high–pericyte coverage B16BL6-bearing animals 24 hours after treatment. Data are shown as the mean ± SEM of at least three images from five mice. One-way ANOVA with the Tukey multiple comparisons test. E and F, Representative intravital images of a high–pericyte coverage B16BL6 tumor, as quantified in D, in a nilotinib-administered animal 24 hours after treatment with nanoparticles (purple) with or without TNF. Arrow, nanoparticles inside the vasculature; asterisk, nanoparticles outside the vasculature. Scale bar, 500 μm. *, P < 0.05; ***, P < 0.001; ****, P < 0.0001. See also Supplementary Figs. S8 and S9.
Figure 4.
Figure 4.
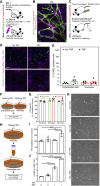
TNF-induced leakage is not a result of direct cellular damage but via subtle endothelial changes via a pericyte-produced factor. A, Intravital experimental procedure to analyze vessel leakage and extravasation of PEG-NPs with or without TNF in tumors. eNOStag-GFP, green fluorescent endothelial cells; Cspg4-DsRed, red fluorescent pericytes; I.V., intravenous injection. B, Representative intravital image of a B16BL6 tumor 24 hours after treatment with nanoparticles (purple) and Hoechst (blue) with TNF. Arrow, extravasation of nanoparticles without cellular destruction. C, Experimental procedure to perform histology in tumors treated with saline or TNF. S.C., subcutaneous injection. D, Representative images of tumors with fluorescent endothelial cells (green) and pericytes (red) 12 hours after treatment with or without TNF and stained for dead cells using TUNEL (purple) and DAPI (blue). E, Quantification of percentage TUNEL-positive endothelial cells and pericytes as represented in D. Data are shown as the mean ± SEM of at least three sections from five individual tumors. Mann–Whitney U test; not significant. F, Experimental procedure to measure cell growth in vitro. G, Quantification of percentage cell growth in the presence of TNF for 12, 24, and 72 hours compared with medium control. Data are shown as the mean ± SEM of at least four individual experiments in triplicate. Mann–Whitney U test; not significant. H, Experimental procedure to measure pericyte effect on the permeability and morphology of the endothelial monolayer in vitro. Conditioned medium (CM), pericyte-conditioned medium. I, Quantification of endothelial permeability after 72 hours of incubation with pericyte-conditioned medium and controls. The average of medium control was set at 100%. J, Quantification of cell elongation, calculated as length to width ratio, of endothelial cells after 72 hours of incubation with pericyte-conditioned medium and controls. In vitro data in I and J are shown as the mean ± SEM of at least four individual experiments in triplicate. Concentrations are in μg/mL. One-way ANOVA with the Tukey multiple comparisons test. **, P < 0.01; ***, P < 0.001; ****, P < 0.0001. K, Representative brightfield images of endothelial cell monolayer, as quantified in J, after incubation with pericyte-conditioned medium and controls. Scale bar, 100 μm; applies to all images.
Figure 5.
Figure 5.
RNA-seq and protein production reveals upregulation of chemokines and specifically CXCL10 in TNF-stimulated pericytes. A, Experimental procedure for RNA-seq and ELISA. B, Log2-fold change in selected genes in TNF-stimulated pericytes vs. endothelial cells. C, Fold change of protein production in TNF-stimulated pericytes vs. endothelial cells. N.D., not detectable. See also Supplementary Fig. S10 and Supplementary Tables S2 and S3.
Figure 6.
Figure 6.
Changes in TNF-induced endothelial cell monolayer and vascular leakage is mediated by CXCL10. A, Experimental procedure to measure CXCL10 effect on the permeability of endothelial cells in vitro. B, Quantification of endothelial permeability after 24 hours of incubation with TNF and CXCL10. The average of medium control is set at 100%. Data are shown as the mean ± SEM of at least four individual experiments in triplicate. Concentrations are in μg/mL. One-way ANOVA with the Tukey multiple comparisons test. C, Experimental procedure to measure pericyte-derived CXCL10-induced permeability changes on the endothelial monolayer in vitro. Conditioned medium, pericyte-conditioned medium. D, Quantification of endothelial permeability after 72 hours incubation with pericyte-conditioned medium in which endogenous produced CXCL10 was neutralized and controls. The average of medium control was set at 100%. Data are shown as the mean ± SEM of at least four individual experiments in triplicate. Concentrations are in μg/mL. One-way ANOVA with the Tukey multiple comparisons test. E, Experimental procedure to analyze the effect of neutralizing endogenously produced CXCL10 on intratumoral doxorubicin accumulation in high–pericyte coverage B16BL6 tumors after treatment. I.V., intravenous injection; S.C., subcutaneous injection. F, Quantification of intratumoral doxorubicin accumulation in high–pericyte coverage B16BL6 tumors dissected 12 hours after treatment with doxil, doxil in combination with TNF, and doxil in combination with TNF and anti-CXCL10. Data are shown as the mean ± SEM of at least two measurements from eight mice. Concentrations are in μg/mouse. One-way ANOVA with the Tukey multiple comparisons test. G, Experimental procedure to analyze the effect of exogenously added CXCL10 in intratumoral doxorubicin accumulation in low–pericyte coverage LLC tumors. H, Quantification of intratumoral doxorubicin accumulation in low–pericyte coverage LLC tumors dissected 12 hours after treatment with doxil, doxil in combination with TNF, and doxil in combination with TNF and CXCL10. Data are shown as the mean ± SEM of at least two measurements from eight mice. Concentrations are in μg/mouse. One-way ANOVA with the Tukey multiple comparisons test; *, P < 0.05; **, P < 0.01; ***, P < 0.001; ****, P < 0.0001. See also Supplementary Figs. S11 and S12.
Figure 7.
Figure 7.
Adding CXCL10 improves the response of low–pericyte coverage LLC tumors when treated with doxil and TNF. A, Experimental procedure to measure tumor response in a loss-of-function experiment in which CXCL10 is neutralized with an antibody in high–pericyte coverage B16BL6 tumor–bearing mice and a gain-of-function experiment in low–pericyte coverage LLC tumor–bearing mice. I.V., intravenous injection; S.C., subcutaneous injection. B, B16BL6 tumor growth, expressed as fold change tumor volume, in tumors treated with doxil, doxil in combination with TNF, and doxil in combination with TNF and anti-CXCL10. Data are shown as the mean ± SD from eight mice. Black arrow, treatment day; green arrow, treatment with anti-CXCL10. Two-way ANOVA with the Tukey multiple comparisons test. C, Survival curve, based on human endpoints (see Materials and Methods for criteria), of B16BL6-bearing animals treated with doxil, doxil in combination with TNF, and doxil in combination with TNF and anti-CXCL10. Black arrow, treatment day; green arrow, treatment with anti-CXCL10. Log-rank test (Mantel–Cox). D, LLC tumor growth, expressed as fold change tumor volume, in tumors treated with doxil, doxil in combination with TNF, and doxil in combination with TNF and CXCL10. Data are shown as the mean ± SD from eight mice. Black arrow, treatment day. Two-way ANOVA with the Tukey multiple comparisons test. E, Survival curve, based on human endpoints (see Materials and Methods for criteria), of LLC-bearing animals treated with doxil, doxil in combination with TNF, and doxil in combination with TNF and CXCL10. Black arrow, treatment day. Log-rank test (Mantel–Cox); *, P < 0.05; ****, P < 0.0001. See also Supplementary Table S4.

References

    1. Bellavite P. Neuroprotective potentials of flavonoids: experimental studies and mechanisms of action. Antioxidants (Basel) 2023;12:280. - PMC - PubMed
    1. Zelová H, Hošek J. TNF-α signalling and inflammation: interactions between old acquaintances. Inflamm Res 2013;62:641–51. - PubMed
    1. Kalliolias GD, Ivashkiv LB. TNF biology, pathogenic mechanisms and emerging therapeutic strategies. Nat Rev Rheumatol 2016;12:49–62. - PMC - PubMed
    1. How Shing Koy E, Labauge P, Baillet A, Prati C, Marotte H, Pers Y-M. Immunomodulation with IL-17 and TNF-alpha in spondyloarthritis: focus on the eye and the central nervous system. Ther Adv Musculoskelet Dis 2021;13:1759720X211025894. - PMC - PubMed
    1. Monaco C, Nanchahal J, Taylor P, Feldmann M. Anti-TNF therapy: past, present and future. Int Immunol 2015;27:55–62. - PMC - PubMed

MeSH terms