. 2025 Mar:113:105620.
doi: 10.1016/j.ebiom.2025.105620. Epub 2025 Feb 25.

Evolution of SARS-CoV-2 antibody repertoire after successive mRNA vaccinations under immunosuppressive treatment

Collaborators, Affiliations

Evolution of SARS-CoV-2 antibody repertoire after successive mRNA vaccinations under immunosuppressive treatment

Jim B D Keijser et al. EBioMedicine. 2025 Mar.

Abstract

Background: Repeated antigen exposure can result in a shifting antibody repertoire. The mechanisms by which this occurs and consequences for cross-variant protection against evolving pathogens remain incompletely understood, particularly in the context of immunosuppressive treatments used in patients with immune-mediated inflammatory diseases (IMID).

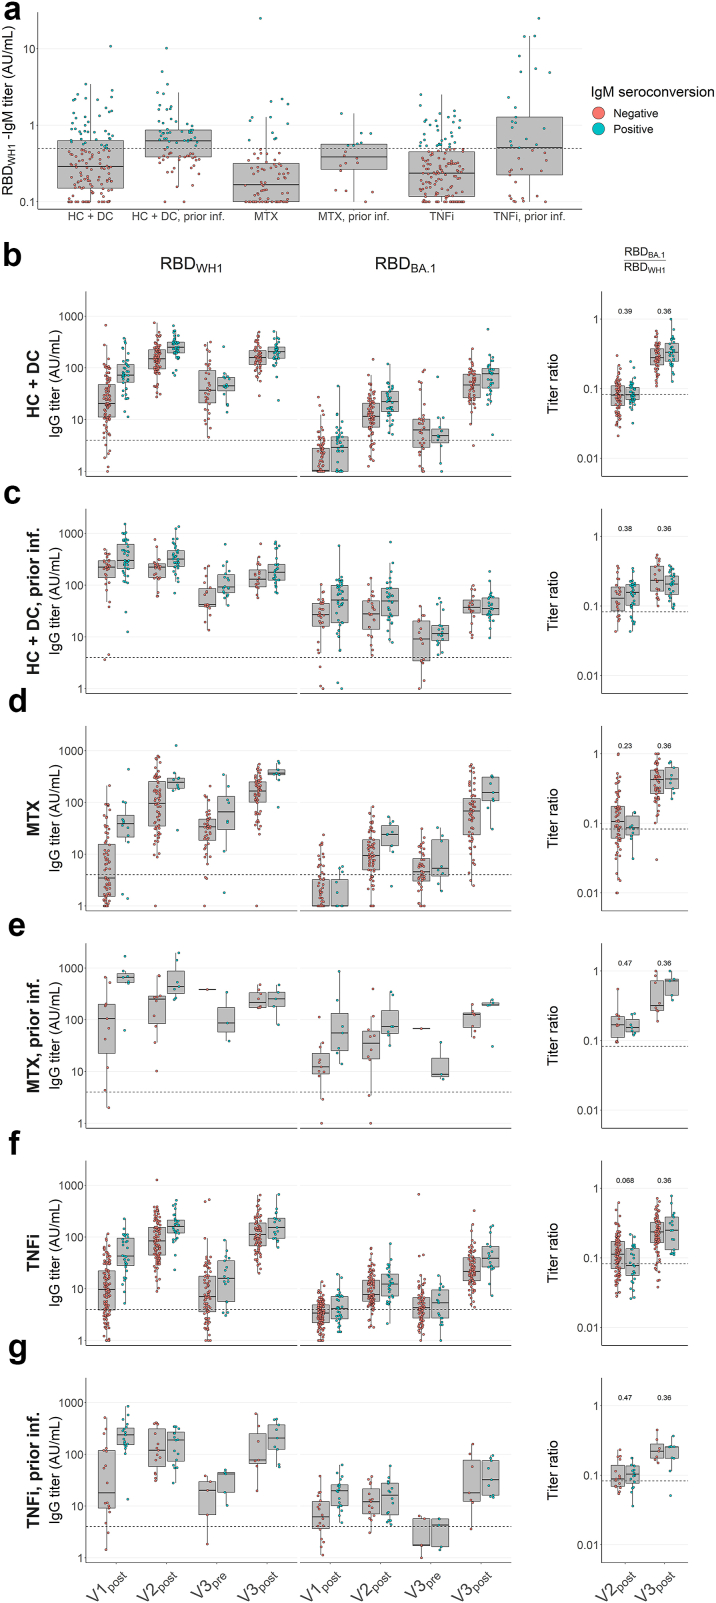
Methods: To investigate this, we characterised longitudinal changes in the anti-SARS-CoV-2 antibody repertoire over the course of three SARS-CoV-2 mRNA vaccinations in patients with IMIDs treated with methotrexate (MTX) and/or tumour necrosis factor-inhibitors (TNFi), anti-CD20 monoclonal antibodies, no systemic therapy, and healthy controls (total N = 878). We determined serum antibody titres against the receptor-binding domain (RBD) of Wuhan-Hu-1 (WH1) and Omicron BA.1 spike proteins, and assessed ratios thereof between groups as a proxy for cross-reactivity.

Findings: We observe emerging anti-BA.1 RBD reactivity over time, notably following a third vaccination. This may be partly explained by affinity maturation, as evaluated by inhibition of ACE2-RBD interactions. Similar trends were seen in patients treated with MTX and/or TNFi, but not in patients on anti-CD20 therapy. SARS-CoV-2 infection prior to vaccination accelerated these effects initially while leading to comparable results after three vaccinations.

Interpretation: MTX and TNFi do not qualitatively alter the evolution of the antibody repertoire in response to repeated antigen exposure, whereas anti-CD20 does. These insights may help to optimise vaccination strategies for patients with immune-mediated inflammatory diseases.

Funding: This study was supported by ZonMw (The Netherlands Organization for Health Research and Development) and SGF (Collaborating Health Funds).

Keywords: Antibody repertoire; Autoimmune disease; SARS-CoV-2; Serology; mRNA vaccines.


Conflict of interest statement

Declaration of interests For funding of this study, SMvH, FE, TWK and TR report grants from ZonMw and SMvH reports a grant from SGF to study immune responses after SARS-Cov-2 vaccination in autoimmune diseases. JK reports grants for multicentre investigator-initiated trials from ZonMw and Treatmeds; contracted research grants to his institution from F. Hoffmann-La Roche Ltd, Biogen, Immunic, Teva, Merck, Novartis and Sanofi/Genzyme; speaker's fees paid to his institution from F. Hoffmann-La Roche Ltd, Biogen, Immunic, Teva, Merck, Novartis and Sanofi/Genzyme; and compensation paid to his institution for participation in an adjudication committee of an MS clinical trial by Immunic. SWT reports grants paid to his institution from GlaxoSmithKline, Pfizer, Roche, AstraZeneca and Galapagos; and speaker's fees paid to his institution from NovoNordisk, AbbVie and UCB. SMvH reports compensation paid to her institution for participation in EU member expert panel HORIZON-HLTH-2023-DISEASE-03-18 and in the supervisory board of EU consortium INsTRuCT, from EU Horizon 2020 grants; unpaid participation in the supervisory board of national consortium DC4BALANCE, in the board of the European Federation of Immunological Societies, as co-project leader of ZonMw COVID-19 research program “Immunity against SARS-CoV-2 in immune-suppressed patients: increased risk of insufficient immunological memory or sufficient protection against re-infection?”, and in the project management board of national consortium ImmuneHealthSeed. FE reports grants from Prinses Beatrix Spierfonds, CSL Behring, Kedrion, Terumo BCT, Grifols, Takeda Pharmaceutical Company, and GBS-CIDP Foundation; consulting fees from UCB Pharma and CSL Behring; and honoraria from Grifols. All other authors declare no competing interests.

Figures

Fig. 1
Fig. 1
Study overview. a Study flowchart. b Vaccination and sampling timeline.
Fig. 2
Fig. 2
Serum IgG titres against SARS-CoV-2 WH1 S, WH1 RBD, and BA.1 RBD in healthy and disease controls. Serum IgG concentrations were assessed by direct ELISA and titres were calculated in arbitrary units (AU) derived from pooled convalescent healthy donor plasma standards collected in early 2020 (WH1 standard) or early 2022 (BA.1 standard), which were set at 100 AU/mL. WH1, Wuhan-Hu-1; RBD, receptor-binding domain; S, spike (full protein). Box plots show anti-WH1 S, anti-WH1 RBD, and anti-BA.1 RBD titres of controls (N = 118 healthy controls + N = 53 disease controls) without infection before vaccination. Dashed lines in titre plots represent seropositivity cutoffs determined as the lowest integer AU value where >99% of pre-pandemic samples were considered negative. In all box plots, central lines indicate the median, with hinges indicating 25th and 75th percentiles. Whiskers indicate the furthest data points up to 1.5 ∗ IQR beyond hinges. V1, V2, V3; first, second and third vaccination.
Fig. 3
Fig. 3
Serum IgG titres against SARS-CoV-2 WH1 and BA.1 RBD, WH1 S and BA.1 RBD in healthy and disease controls with and without prior infection. Serum IgG concentrations were assessed by direct ELISA and titres were calculated in arbitrary units (AU) derived from pooled convalescent healthy donor plasma standards collected in early 2020 (WH1 standard) or early 2022 (BA.1 standard), which were set at 100 AU/mL. WH1, Wuhan-Hu-1; RBD, receptor-binding domain. a and b Box plots showing anti-WH1 RBD and anti-BA.1 RBD titres, and comparative ratios of controls without infection before vaccination (a, N = 118 healthy controls + N = 53 disease controls, titre data repeated from Fig. 2) and with prior infection (b, N = 73 + 19). Dashed lines in titre plots represent seropositivity cutoffs determined as the lowest integer AU value where >99% of pre-pandemic samples were considered negative. Dashed lines in ratio figures represent the median of naïve controls (a) at V2post for comparison. In all box plots, central lines indicate the median, with hinges indicating 25th and 75th percentiles. Whiskers indicate the furthest data points up to 1.5 ∗ IQR beyond hinges. V1, V2, V3; first, second and third vaccination. Significance marks below box plots indicate comparisons to naïve controls (a) at the same timepoint. Comparisons were made using Kruskal–Wallis tests and Conover–Iman post-hoc multiple comparisons with Benjamini-Hochberg correction.
Fig. 4
Fig. 4
Serum IgG titres against SARS-CoV-2 WH1 and BA.1 RBD, WH1 S and BA.1 RBD in healthy and disease controls, and patients under immunosuppressive treatment, with and without prior infection, as predicted by IgM titres after first vaccination. Serum IgG and IgM concentrations were assessed by direct ELISA and titres were calculated in arbitrary units (AU) derived from pooled convalescent healthy donor plasma standards collected in early 2020 (WH1 standard) or early 2022 (BA.1 standard), which were set at 100 AU/mL. WH1, Wuhan-Hu-1; RBD, receptor-binding domain. a Box plots showing anti-WH1 RBD IgM titres at V1post. b–g Box plots showing anti-WH1 RBD and anti-BA.1 RBD IgG titres, and comparative ratios, divided and compared by IgM seroconversion as shown in (a). Panel b corresponds to data shown in Fig. 3a–d to Fig. 5a, b e, f and g. Dashed lines in titre plots represent seropositivity cutoffs determined as the lowest integer AU value where >99% of pre-pandemic samples were considered negative. Dashed lines in ratio figures represent the median of naïve controls (Fig. 2a) at V2post for comparison. In all box plots, central lines indicate the median, with hinges indicating 25th and 75th percentiles. Whiskers indicate the furthest data points up to 1.5 ∗ IQR beyond hinges. V1, V2, V3; first, second and third vaccination. Significance marks above box plots indicate comparisons between V1post IgM-negative and -positive subgroups. Comparisons were made using Kruskal–Wallis tests and Conover–Iman post-hoc multiple comparisons with Benjamini-Hochberg correction.
Fig. 5
Fig. 5
Serum IgG titres against SARS-CoV-2 WH1 and BA.1 RBD, WH1 S and BA.1 RBD in patients under immunosuppressive treatment with and without prior infection. Serum IgG concentrations were assessed by direct ELISA and titres were calculated in arbitrary units (AU) derived from pooled convalescent healthy donor plasma standards collected in early 2020 (WH1 standard) or early 2022 (BA.1 standard), which were set at 100 AU/mL. WH1, Wuhan-Hu-1; RBD, receptor-binding domain; S, spike (full protein). a–h Box plots showing anti-WH1 RBD and anti-BA.1 RBD titres, and comparative ratios of patients without infection before vaccination on MTX monotherapy (a, N = 106), patients on TNFi monotherapy (b, N = 187), patients on MTX + TNFi combination therapy (c, N = 63), patients on anti-CD20 therapy (d, N = 154), and the same groups with prior infection (e–h, N = 20, 53, 15, and 17 respectively). Dashed lines in titre plots represent seropositivity cutoffs determined as the lowest integer AU value where >99% of pre-pandemic samples were considered negative. Dashed lines in ratio figures represent the median of naïve controls (Fig. 3a) at V2post for comparison. In all box plots, central lines indicate the median, with hinges indicating 25th and 75th percentiles. Whiskers indicate the furthest data points up to 1.5 ∗ IQR beyond hinges. V1, V2, V3; first, second and third vaccination. Significance marks below box plots indicate comparisons to naïve controls (Fig. 3a) at the same timepoint. Comparisons were made using Kruskal–Wallis tests and Conover–Iman post-hoc multiple comparisons with Benjamini-Hochberg correction.
Fig. 6
Fig. 6
Serum RBD-ACE2 binding inhibition. Serum capacity to interfere with RBD-ACE2 binding was assessed by competition ELISA. RBD, receptor-binding domain of spike protein; ACE2, human angiotensin-converting enzyme 2. Inhibition was expressed as remaining signal intensity normalised to that of pooled convalescent healthy donor plasma standards collected in early 2020 (WH1 standard) or early 2022 (BA.1 standard), where 100% represents signal intensity at the lowest concentration of standard and 0% represents signal intensity at the highest concentration of standard. WH1, Wuhan-Hu-1. a Line plots showing inhibition as a function of effective titre (corresponding anti-WH1 or anti-BA.1 RBD titre divided by dilution factor) in N = 20 each healthy controls, disease controls (pooled as controls) and patients on MTX therapy. Curves presented as median normalised remaining signal with 95% confidence interval, and median effective titre. b and c Box plots showing individual IC50 (b) and IC80 (c) effective titres as calculated from 4-parameter logistic curve-fit. IC50, effective titre at which normalised signal was reduced to 50%; IC80, effective titre at which normalised signal was reduced to 20% (i.e. 80% inhibition). Samples are not shown in respective plots if IC50 or IC80 titre could not be derived through curve-fitting as in (a). In all box plots, central lines indicate the median, with hinges indicating 25th and 75th percentiles. Whiskers indicate the furthest data points up to 1.5 ∗ IQR beyond hinges. V1, V2, V3; first, second and third vaccination. Comparisons were made using Mann–Whitney U-tests and Benjamini-Hochberg correction. FD, fold decrease from V2post to V3post (median of individual fold decreases).

References

    1. Baden L.R., El Sahly H.M., Essink B., et al. Efficacy and safety of the mRNA-1273 SARS-CoV-2 vaccine. N Engl J Med. 2021;384(5):403–416. http://www.nejm.org/doi/10.1056/NEJMoa2035389 Available from: - DOI - PMC - PubMed
    1. Polack F.P., Thomas S.J., Kitchin N., et al. Safety and efficacy of the BNT162b2 mRNA Covid-19 vaccine. N Engl J Med. 2020;383(27):2603–2615. http://www.nejm.org/doi/10.1056/NEJMoa2034577 Available from: - DOI - PMC - PubMed
    1. Wang L., Cheng G. Sequence analysis of the emerging SARS-CoV-2 variant Omicron in South Africa. J Med Virol. 2022;94(4):1728–1733. https://onlinelibrary.wiley.com/doi/10.1002/jmv.27516 Available from: - DOI - PubMed
    1. Majumdar S., Sarkar R. Mutational and phylogenetic analyses of the two lineages of the Omicron variant. J Med Virol. 2022;94(5):1777–1779. https://onlinelibrary.wiley.com/doi/10.1002/jmv.27558 Available from: - DOI - PMC - PubMed
    1. Muecksch F., Wang Z., Cho A., et al. Increased memory B cell potency and breadth after a SARS-CoV-2 mRNA boost. Nature. 2022;607(7917):128–134. http://www.ncbi.nlm.nih.gov/pubmed/35447027 Available from: - PMC - PubMed