. 2025 Feb 25;13(2):e010153.
doi: 10.1136/jitc-2024-010153.

Effector T cells under hypoxia have an altered transcriptome similar to tumor-stressed T cells found in non-responsive melanoma patients

Affiliations

Effector T cells under hypoxia have an altered transcriptome similar to tumor-stressed T cells found in non-responsive melanoma patients

Mate Z Nagy et al. J Immunother Cancer. .

Abstract

Background: In the tumor microenvironment (TME), hypoxia stands as a significant factor that modulates immune responses, especially those driven by T cells. As T cell-based therapies often fail to work in solid tumors, this study aims to investigate the effects of hypoxia on T cell topo-distribution in the TME, gene expression association with T cell states, and clinical responses in melanoma.

Methods: To generate detailed information on tumor oxygenation and T cell accessibility, we used mathematical modeling of human melanoma tissue microarrays that incorporate oxygen supply from vessels, intratumoral diffusion, and cellular uptake. We created tumor maps and derived plots showing the fraction of CD4 and CD8 T cells against the distance to the nearest vessel and oxygen pressure. To assess their function and transcriptional changes caused by hypoxia, effector T cells were generated and cultured under hypoxia (0.5% oxygen) or normoxia (21% oxygen). The T cell hypoxia-transcriptional signature was compared against datasets from msigDB, iATLAS (clinical trials of melanoma patients treated with immune checkpoint inhibitors (ICIs)), ORIEN AVATAR (real-world melanoma patients treated with ICIs), and a single-cell atlas of tumor-infiltrating lymphocytes.

Results: We made three specific observations: (1) in melanoma T cells preferentially accumulated in oxygenated areas close to blood vessels (50-100 µm from the vasculature in the regions of high oxygen availability) but not in hypoxic areas far from blood vessels. (2) Our analysis confirmed that under hypoxia, T cell functions were significantly reduced compared with normoxic conditions and accompanied by a unique gene signature. Furthermore, this hypoxic gene signature was prevalent in resting and non-activated T cells. Notably and clinically relevant, the hypoxic T cell gene set was found to correlate with reduced overall survival and reduced progression-free survival in melanoma patients, which was more pronounced in non-responder patients undergoing ICI therapy. (3) Finally, compared with a single-cell atlas of tumor-infiltrating T cells, our hypoxia signature aligned with a population of cells at a state termed stress response state (TSTR).

Conclusions: Our study highlights the critical role of hypoxia in shaping T cell distribution and its correlation with clinical outcomes in melanoma. We revealed a preferential accumulation of T cells in oxygenated areas. Moreover, hypoxic T cells develop a distinct hypoxic gene signature prevalent in resting, non-activated T cells and TSTR that was also associated with poorer outcomes, particularly pronounced among non-responders to ICIs.

Keywords: Gene expression profiling - GEP; Immune Checkpoint Inhibitor; Melanoma; Tumor infiltrating lymphocyte - TIL; Tumor microenvironment - TME.


Conflict of interest statement

Competing interests: No, there are no competing interests.

Figures
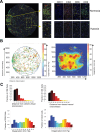
Figure 1
Figure 1. Spatial distribution of T cells in human melanoma correlates with oxygen accessibility and proximity to blood vessels. (A) Representative images of human melanoma TMAs stained with CD31 (vasculature), CD4, CD8, and CD3 (T cells). (B) Corresponding computationally reconstructed oxygenation map of TMA with CD3 in light blue dots, CD8 T cells shown as green dots, and CD4 T cells as orange dots. Within the TME, the dark blue regions indicate hypoxic conditions (≤5 mm Hg), while the orange and red regions indicate well-oxygenated conditions (≥40 mm Hg). (C) Quantification of the fractions of CD4 and CD8 T cells relative to their distance from the nearest blood vessel and (D) corresponding oxygen pressure sensed by the CD8 and CD4 cells. TMAs, tissue microarrays; TME, tumor microenvironment.
Figure 2
Figure 2. T cell localization and oxygenation are similar in TMAs of tumor cores and peripheries (A) Core: Quantification of CD8 and CD4 T cell average distributions across all TMAs—core sections relative to the distance from the nearest blood vessel and corresponding oxygen pressure in tumor cores. (B) Peripheral: CD8 and CD4 T cell average distributions in the TME—periphery relative to the distance from the nearest blood vessel and corresponding oxygen pressure in tumor peripheries. Vertical lines show SEM. TMAs, tissue microarrays; TME, tumor microenvironment.
Figure 3
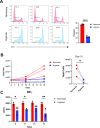
Figure 3. T cell proliferation and cytokine secretion are impaired under hypoxic conditions. (A) Cell proliferation of human T cells from three healthy donors under normoxia and hypoxia. T cells were activated with anti-CD3 mAb and IL-2 for 6 days, then cultured under normoxic (21% O₂) or hypoxic (0.5% O₂) conditions for 3 days. Cell proliferation was assessed using CTV staining. (B) Cell counts on days 0, 10, and 15 under normoxia and hypoxia. (C) IFN-γ secretion on days 8, 11, 13, and 15 after restimulation with plate-bound anti-CD3 mAb. N=3 healthy donors. *p<0.05, **p<0.01, ****p<0.0001 by one-way ANOVA. ANOVA, analysis of variance.
Figure 4
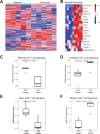
Figure 4. Hypoxia induces a resting-like gene expression profile in T cells. (A) Gene expression patterns in effector T cells exposed to normoxic versus hypoxic conditions, illustrating the overall changes in gene expression profiles when T cells are subjected to hypoxic (0.5% oxygen) compared with normoxic (21% oxygen) environments. (B) Genes significantly reduced in effector T cells under hypoxia compared with normoxia. (C) T cell hypoxia gene signature enrichment in resting CD4 T cells. The gene expression profile for T cells under hypoxic conditions is enriched for genes typically upregulated in resting CD4 T cells, suggesting a shift towards a more quiescent state. (D) T cell hypoxia gene signature enrichment in activated CD4 T cells. Under normoxic conditions, there is a higher expression of genes associated with activated CD4 T cells, contrasting with the hypoxic condition which does not show this activation signature. (E) T cell hypoxia gene signature enrichment in naive CD8 T cells. Under hypoxic conditions, there is an enrichment of genes typically upregulated in naive CD8 T cells, again pointing toward a less active, more resting-like state. (F) T cell hypoxia gene signature enrichment in effector CD8 T cells. The gene expression profiles of effector CD8 T cells under normoxic conditions, where an active, effector signature is prominent, contrast with the hypoxic condition, showing reduced expression of these effector genes. Unpaired two-sample Wilcoxon test of significances is shown.
Figure 5
Figure 5. Hypoxic T cell signature and its clinical implications in melanoma. (A) Overall survival analysis of melanoma patients from the iATLAS dataset. A high hypoxic T cell signature correlates with significantly reduced overall survival. (B) Progression-free survival analysis showing lower rates in patients with a high hypoxic T cell signature. (C, D) Survival analysis of melanoma patients from the Moffitt ORIEN cohort treated with immune checkpoint inhibitors. A high hypoxic T cell signature correlates with decreased survival rates in patients treated with ipilimumab (IPI) and nivolumab (NIVO). Survival was estimated based on the Kaplan-Meier method.
Figure 6
Figure 6. T cell hypoxia-signature resembles CD4/CD8 stressed tumor T cells (TSTR States). (A, B) Under hypoxic conditions, 2943 CD8 T cells were stressed versus 1923 not stressed. Under normoxic conditions, 2376 CD8 T cells were stressed vs 102,976 not stressed. Pearson’s χ2 test (χ²=34,319, df=1) and Fisher’s exact test (p<2.2e−16, OR=66.4, 95% CI: 61.7 to 71.1) indicate a significant association, with higher odds of CD8 T cells being stressed under hypoxia. (C, D) Under hypoxic conditions, 6271 CD4 T cells were stressed vs 3183 not stressed. Under normoxic conditions, 8666 CD4 T cells were stressed vs 153,641 not stressed. Pearson’s χ2 test (χ²=41,848, df=1) and Fisher’s exact test (p<2.2e−16, OR=34.9, 95% CI: 33.3 to 36.7) indicate a significant association, with higher odds of CD4 T cells being stressed under hypoxia.

References

    1. Carmeliet P, Jain RK. Principles and mechanisms of vessel normalization for cancer and other angiogenic diseases. Nat Rev Drug Discov. 2011;10:417–27. doi: 10.1038/nrd3455. - DOI - PubMed
    1. Höckel M, Vaupel P. Tumor hypoxia: definitions and current clinical, biologic, and molecular aspects. J Natl Cancer Inst. 2001;93:266–76. doi: 10.1093/jnci/93.4.266. - DOI - PubMed
    1. Semenza GL. Targeting HIF-1 for cancer therapy. Nat Rev Cancer. 2003;3:721–32. doi: 10.1038/nrc1187. - DOI - PubMed
    1. Vaupel P, Harrison L. Tumor hypoxia: causative factors, compensatory mechanisms, and cellular response. Oncologist. 2004;9 Suppl 5:4–9. doi: 10.1634/theoncologist.9-90005-4. - DOI - PubMed
    1. Bannoud N, Dalotto-Moreno T, Kindgard L, et al. Hypoxia Supports Differentiation of Terminally Exhausted CD8 T Cells. Front Immunol. 2021;12:660944. doi: 10.3389/fimmu.2021.660944. - DOI - PMC - PubMed