. 2025 Feb 26;16(1):1921.
doi: 10.1038/s41467-025-56866-y.

Control of plasma membrane-associated actin polymerization specifies the pattern of the cell wall in xylem vessels

Affiliations

Control of plasma membrane-associated actin polymerization specifies the pattern of the cell wall in xylem vessels

Saku T Kijima et al. Nat Commun. .

Abstract

Cell wall patterning is central to determining the shape and function of plant cells. Protoxylem and metaxylem vessel cells deposit banded and pitted cell walls, respectively, which enable their distinctive water transport capabilities. Here, we show that the pitted cell wall pattern in metaxylem vessels is specified by transcriptional control of actin polymerization. A newly isolated allele of KNOTTED-LIKE HOMEOBOX TRANSCRIPTION FACTOR 7 (KNAT7) was associated with the formation of banded cell walls in metaxylem vessels. Loss of KNAT7 caused misexpression of FORMIN HOMOLOGY DOMAIN CONTAINING PROTEIN11 (FH11) in the metaxylem, which in turn caused rearrangements of ROP GTPases and microtubules in banded patterns. FH11 function required its plasma membrane anchoring and actin polymerization activity. These results suggest that excessive actin polymerization at the plasma membrane abolishes the pitted cell wall formation and promotes banded cell wall formation in metaxylem vessels. This study unveils the importance of proper control of actin polymerization for cell wall pattern determination.


Conflict of interest statement

Competing interests: The authors declare no competing interests.

Figures
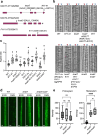
Fig. 1
Fig. 1. KNAT7 and FH11 regulate cell wall patterns in root metaxylem vessels.
a Diagram showing locations of T-DNA insertions and a mutation in the knat7, knat3, and fh11 mutants. b Differential interference contrast (DIC) microscopy images of metaxylem vessels in roots of wild-type (WT), #77-41, knat7, knat7 harboring KNAT7pro:KNAT7-EYFP (knat7 + KNAT7), fh11, IRX3pro:FH11-tagRFP (FH11 ox), knat7 fh11, knat7 fh11 harboring FH11pro:FH11-EYFP (knat7 fh11 + FH11), knat3, and knat3 knat7 plants. Red arrowheads indicate metaxylem vessels; blue arrowheads indicate protoxylem vessels. Scale bars = 5 µm. c Aspect ratio of deviation of brightness along the horizontal and vertical axes of metaxylem vessels. Asterisks indicate significant differences between WT and each line by one-way ANOVA with Dunnett’s post hoc test; n = 15 plants; *: P < 0.0001; ns: no significant difference. d FH11-EYFP (FH11pro:FH11-EYFP) expression in the cortex of protoxylem (proto) and metaxylem (meta) vessels in roots of WT, knat7, and knat3 knat7 plants. Scale bars = 5 µm. e Intensity of FH11-EYFP (FH11pro:FH11-EYFP) fluorescence. Box plots indicate the median (horizontal line), interquartile range (25% to 75%), and the minimum and maximum of the data (whiskers); dots are individual data points. Asterisks indicate significant differences by one-way ANOVA with Tukey’s test; n = 14 (WT), 15 (knat7), 16 (knat3 knat7) cells in protoxylem, n = 15 cells in metaxylem; *: P < 0.05, ****: P < 0.0001; ns: no significant difference.
Fig. 2
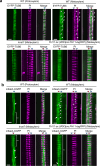
Fig. 2. The alignment of the cytoskeleton in metaxylem cells in knat7 and FH11-expressing plants resembles that in protoxylem vessels.
a and b Microtubules (IRX3pro:EYFP-TUB6) (a) and actin filaments (MIDD1pro:Lifeact-mGFP) (b) in protoxylem and metaxylem vessel cells of wild-type (WT), knat7, and FH11-expressing (FH11 ox, IRX3pro:FH11-tagRFP) plants. Cell walls were labeled with propidium iodide (PI). The images are representative of three independent experiments. White arrowheads indicate pits; white arrows indicate actin cables; curly brackets indicate areas of weak fluorescence; red arrowheads indicate metaxylem vessels; blue arrowheads indicate protoxylem vessels. Individual images show the cortex; the corresponding mid-plane sections are shown in Supplementary Figs. 6 and 8. Scale bars = 5 µm.
Fig. 3
Fig. 3. FH11 localizes at the plasma membrane and promotes polymerization of actin filaments.
a Diagram of FH11 protein showing truncated fragments. SP, EC and TM indicate the signal peptide, extra-cytoplasmic Ser/Pro rich, and transmembrane domains, respectively. Numbers indicate the locations of amino acid residues relative to the full-length protein. b and c FH11 (LexApro:FH11-EYFP) and plasma membrane (FM4-64) in Arabidopsis cells cultured without (b) or with (c) 400 mM mannitol. In (b), the intensity profiles along the white lines (indicated by white arrowheads) are shown in graphs to the right of each panel. The white box in (c) shows Hechtian strands induced by 400 mM mannitol; an enlarged image of this area is shown in the far-right panel. The images are representative of three independent experiments. All scale bars = 20 µm, except for the enlarged image, in which scale bar = 10 µm. d Actin filaments (UBQ10pro:Lifeact-mGFP) in root epidermal cells harboring LexApro:FH11-tagRFP treated with (+Est) or without (-Est) 2 µM estradiol. Arrows indicate actin cables. The lower panels show xz slices along the white lines. Scale bars = 5 µm [xy] or 2.5 µm [xz]. e Skewness and density of actin filaments. Dots are individual data points; the horizontal line indicates the median; n = 51 (-Est) and 52 (+Est) cells; ****: P < 0.0001 (two-tailed Student’s t-test). f Histogram of fluorescent intensity along the white lines shown in (d). Mean values ± standard deviations are Control: 1636.8 ± 2243.3; FH11 (full): 840.8 ± 220.8, (two-tailed Student’s t-test, P = 1.20E-6).
Fig. 4
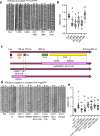
Fig. 4. The transmembrane and FH1-FH2 domains of FH11 are required for the formation of banded cell walls in metaxylem vessels.
a DIC images of metaxylem vessels in roots expressing truncated FH11 proteins. The truncated proteins shown in Fig. 3a were fused with EYFP at the C-terminus and expressed under the control of the IRX3 promoter. Red and blue arrowheads indicate metaxylem and protoxylem vessels, respectively. Scale bars = 5 µm. b Aspect ratio of deviation of brightness along the horizontal and vertical axes of metaxylem vessels. Asterisks indicate significant differences between lines expressing full-length (Full, IRX3pro:FH11-EYFP) and truncated FH11 by one-way ANOVA with Dunnett’s post hoc test; n = 15; *: P < 0.0001; ns: no significant difference. c Diagram of FH11 proteins containing mutations or domain swaps. Numbers indicate the positions of amino acid residues relative to the beginning of the full-length protein. d DIC images of metaxylem vessels in the roots of plants expressing the indicated forms of FH11. Each form of FH11 was fused with tagRFP at the C-terminus and expressed under the control of the IRX3 promoter. Red and blue arrowheads indicate metaxylem and protoxylem vessels, respectively. Expression of each exogenous FH11 was verified by confocal microscopy (Supplementary Fig. 18). Scale bars = 5 µm. e Aspect ratio of deviation of brightness along the horizontal and vertical axes of metaxylem vessels. Asterisks indicate significant differences between wild-type (WT) plants and lines expressing FH11 by one-way ANOVA with Dunnett’s post hoc test; n = 15; *: P < 0.0001; **: P < 0.005; ns: no significant difference.
Fig. 5
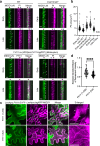
Fig. 5. FH11 expression results in diffuse localization of active ROPs in mature metaxylem vessels.
a Localization of active ROPs (MIDD1pro:MIDD1ΔN-GFP) and cell walls (PI) in root metaxylem cells of wild-type (WT), knat3 kant7, and FH11-expressing plants (FH11 ox, IRX3pro:FH11-tagRFP) at the early and the late stages of metaxylem formation. White arrows indicate MIDD1ΔN-GFP fluorescence; white arrowheads indicate pit regions; red and blue arrowheads indicate metaxylem and protoxylem vessels, respectively. Scale bars = 5 µm. b Areas of MIDD1ΔN-GFP fluorescence spots were measured at the early and late stages of metaxylem vessel formation. MIDD1ΔN-GFP fluorescence areas could not be measured in FH11-expressing cells during the late stage due to diffusion (N.D.: not determined). Letters indicate significant differences between individual lines in one-way ANOVA with Dunnett’s post hoc test; n = 200 (Early-WT), 190 (Late-WT), 140 (Early-knat3 kant7), 140 (Late-knat3 knat7) and 152 (Early-FHox) pits; P < 0.0001. c Localization of tagRFP-MIDD1 (LexApro:tagRFP-MIDD1) and truncated FH11-EYFP (1-250, LexApro:FH11 (1-250)-EYFP) or full length FH11-EYFP (full, LexApro:FH11-EYFP) in epidermal cells of N. benthamiana co-expressing LexApro:ROP11, LexApro:ROPGAP3, and LexApro:ROPGEF4PRONE. The areas of white boxes are enlarged in the right panels. Arrows and arrowheads indicate the assembly of active ROPs and microtubules marked with MIDD1, respectively. Note that microtubules associate with the area occupied with active ROPs. Scale bars = 10 µm. See also Supplementary Figs. 20 and 21. d Standard deviation of the intensity of tagRFP-MIDD1. Dots represent individual data points in individual cells, while horizontal lines indicate the median value, n = 81 (FH11 (1-250)) and 119 (FH11 (full)) cells, ****P < 0.0001 (two-tailed Student’s t test).
Fig. 6
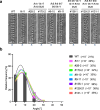
Fig. 6. Knocking out FH genes disrupts cell wall band formation in protoxylem vessels.
a Protoxylem vessel cells in the roots of FH-knockout mutants. Supplementary Fig. 23 contains detailed information about these mutants. Blue arrowheads indicate protoxylem vessels. Scale bars = 5 µm. b Angle of stripes in protoxylem vessel cells in the roots of FH-knockout mutants. The x-axis shows stripe angles in 10° increments and the y-axis the relative frequency of stripes within each increment. The values for individual lines are shown in the stacked bar graph. The individual segmented graphs are shown in Supplementary Fig. 24. The solid lines superimposed on the graph represent the theoretical curves of a Gaussian distribution. The proportions of stripes with angles > 10° for each line are shown on the right of the graph. n = 829 (WT), 883 (fh11), 870 (#28-2), 769 (#170-2), 1005 (#9-10), 909 (#9-11), 909 (#136-1), 788 (#129-21) and 698 (#131-1) stripes.
Fig. 7
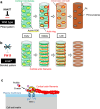
Fig. 7. Schematic illustration of cell wall pattern formation in metaxylem vessels.
a KNAT7 suppresses the expression of FH11 in the metaxylem vessels of wild-type plants, causing a pitted cell wall pattern to form. Secondary cell walls are deposited on microtubules. Active ROPs localize to spots on the plasma membrane where the microtubules are depolymerized through the MIDD1-Kinesin-13A pathway, ultimately leading to the formation of pits at points where the secondary cell wall is not deposited. Actin rings form around the spots of active ROPs and promote the deposition of secondary cell wall at pit boundaries. b In metaxylem vessels of knat7, misexpression of FH11 leads to the formation of a banded cell wall pattern. FH11 promotes the polymerization of cortical actin filaments, which disperses the ROP domains. c Dimeric FH11 on the plasma membrane promotes the polymerization of cortical actin filaments from monomeric actin bound to profilin. The extracellular domain of FH11 may interact with the cell wall matrix.

References

    1. Meents, M. J., Watanabe, Y. & Samuels, A. L. The cell biology of secondary cell wall biosynthesis. Ann Bot. 121, 1107–1125 (2018). - PMC - PubMed
    1. Zhong, R. Q., Cui, D. T. & Ye, Z. H. Secondary cell wall biosynthesis. New Phytologist221, 1703–1723 (2019). - PubMed
    1. Oda, Y. & Fukuda, H. Secondary cell wall patterning during xylem differentiation. Curr. Opin. Plant Biol.15, 38–44 (2012). - PubMed
    1. Xu, H. et al. Secondary cell wall patterning-connecting the dots, pits and helices. Open Biol. 12, 210208 (2022). - PMC - PubMed
    1. Watanabe, Y. et al. Visualization of cellulose synthases in Arabidopsis secondary cell walls. Science350, 198–203 (2015). - PubMed

LinkOut - more resources