

Multinational modelling of PM2.5 and CO exposures from household air pollution in peri-urban Cameroon, Ghana and Kenya
- PMID: 40011484
- PMCID: PMC11865494
- DOI: 10.1038/s41598-024-81413-y
Multinational modelling of PM2.5 and CO exposures from household air pollution in peri-urban Cameroon, Ghana and Kenya
Abstract
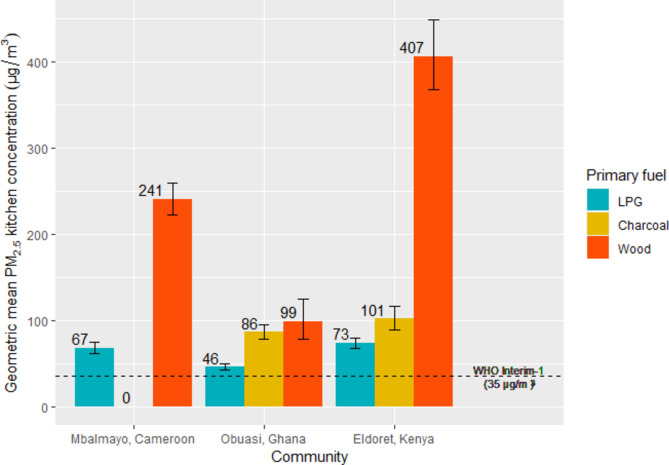
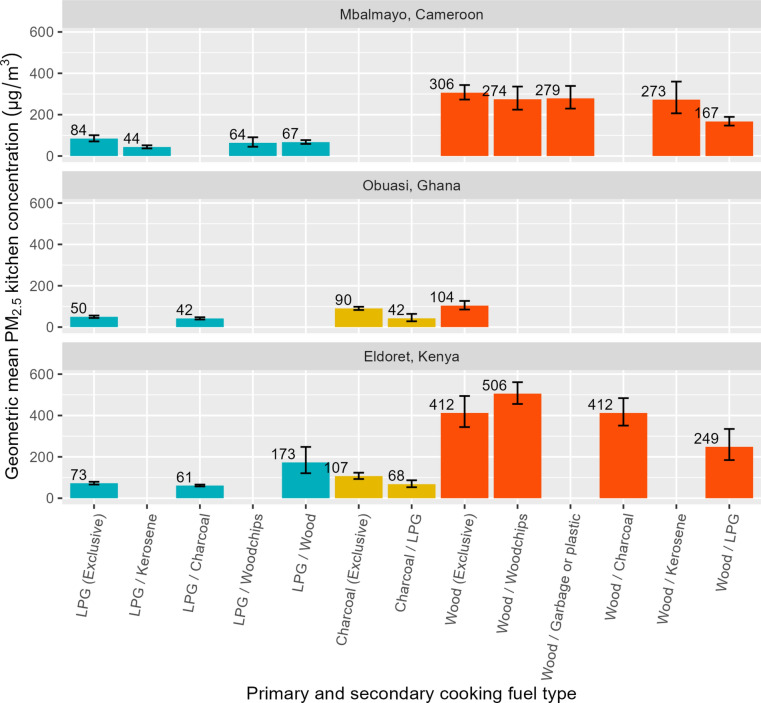
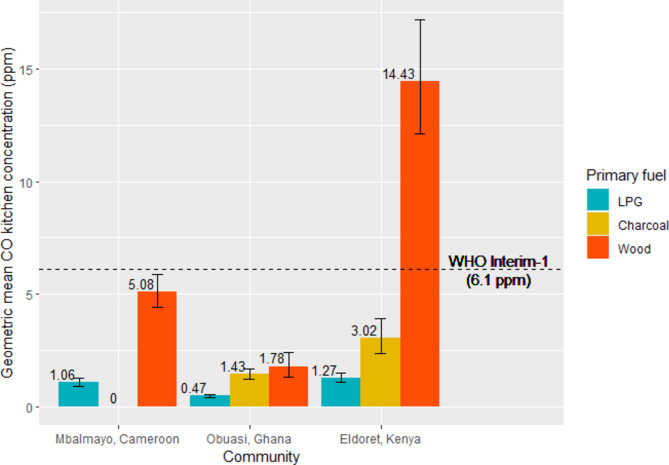
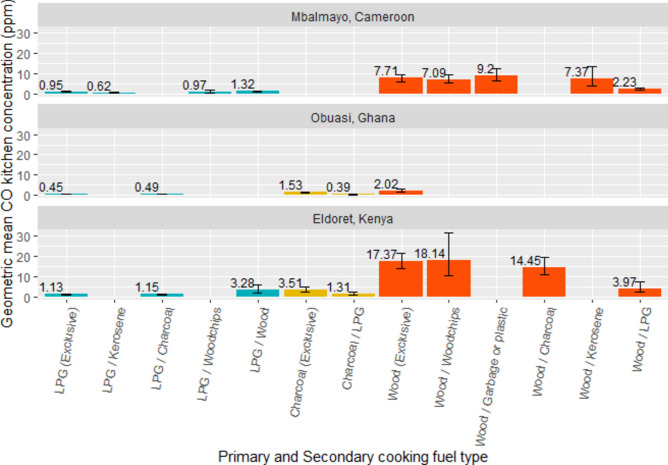
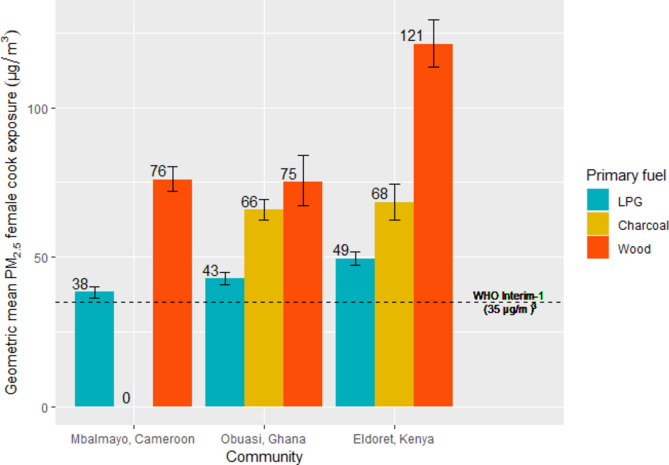
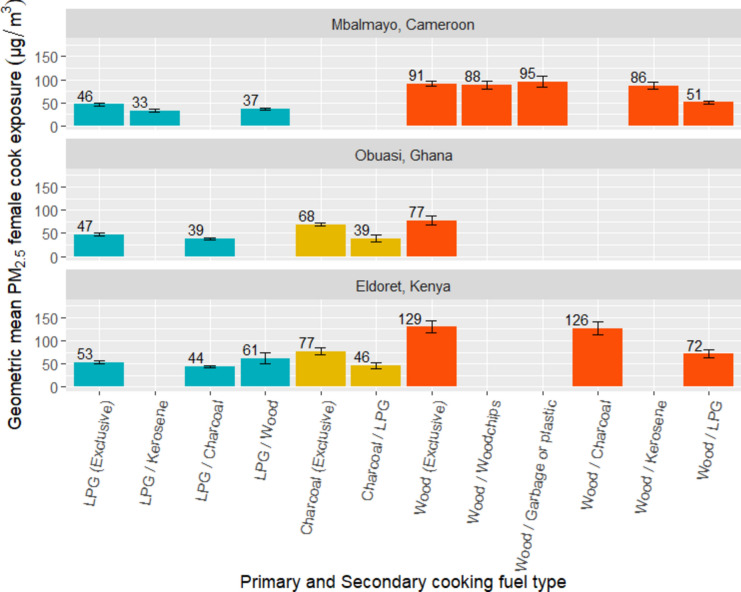
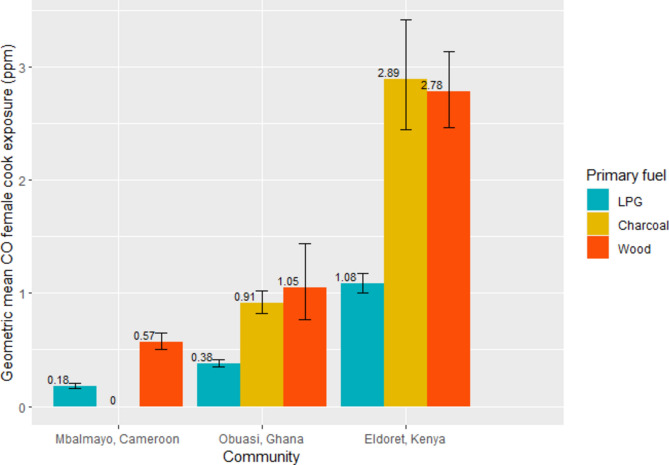
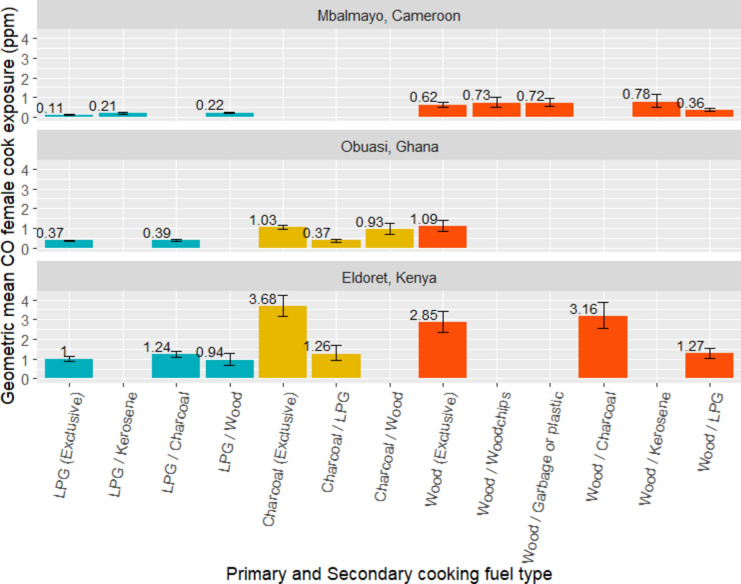
In sub-Saharan Africa, approximately 85% of the population uses polluting cooking fuels (e.g. wood, charcoal). Incomplete combustion of these fuels generates household air pollution (HAP), containing fine particulate matter (PM2.5 ) and carbon monoxide (CO). Due to large spatial variability, increased quantification of HAP levels is needed to improve exposure assessment in sub-Saharan Africa. The CLEAN-Air(Africa) study included 24-h monitoring of PM2.5 and CO kitchen concentrations (npm2.5 = 248/nCO = 207) and female primary cook exposures (npm2.5 = 245/nCO = 222) in peri-urban households in Obuasi (Ghana), Mbalmayo (Cameroon) and Eldoret (Kenya). HAP measurements were combined with survey data on cooking patterns, socioeconomic characteristics and ambient exposure proxies (e.g. walking time to nearest road) in separate PM2.5 and CO mixed-effect log-linear regression models. Model coefficients were applied to a larger study population (n = 937) with only survey data to quantitatively scale up PM2.5 and CO exposures. The final models moderately explained variation in mean 24-h PM2.5 (R2 = 0.40) and CO (R2 = 0.26) kitchen concentration measurements, and PM2.5 (R2 = 0.27) and CO (R2 = 0.14) female cook exposures. Primary/secondary cooking fuel type was the only significant predictor in all four models. Other significant predictors of PM2.5 and CO kitchen concentrations were cooking location and household size; household financial security and rental status were only predictive of PM2.5 concentrations. Cooking location, household financial security and proxies of ambient air pollution exposure were significant predictors of PM2.5 cook exposures. Including objective cooking time measurements (from temperature sensors) from (n = 143) households substantially improved (by 52%) the explained variability of the CO kitchen concentration model, but not the PM2.5 model. Socioeconomic characteristics and markers of ambient air pollution exposure were strongly associated with mean PM2.5 measurements, while cooking environment variables were more predictive of mean CO levels.
Keywords: CO; Household air pollution; PM2.5; Predictive modelling; Sub-Saharan Africa.
© 2025. The Author(s).
Conflict of interest statement
Declarations. Competing interests: The authors have no competing interests to declare.
Figures
Similar articles
-
Household concentrations and female and child exposures to air pollution in peri-urban sub-Saharan Africa: measurements from the CLEAN-Air(Africa) study.Lancet Planet Health. 2024 Feb;8(2):e95-e107. doi: 10.1016/S2542-5196(23)00272-3. Lancet Planet Health. 2024. PMID: 38331535 Free PMC article.
-
Multinational prediction of household and personal exposure to fine particulate matter (PM2.5) in the PURE cohort study.Environ Int. 2022 Jan 15;159:107021. doi: 10.1016/j.envint.2021.107021. Epub 2021 Dec 13. Environ Int. 2022. PMID: 34915352
-
Personal exposures to fine particulate matter and black carbon in households cooking with biomass fuels in rural Ghana.Environ Res. 2013 Nov;127:40-8. doi: 10.1016/j.envres.2013.08.009. Epub 2013 Oct 28. Environ Res. 2013. PMID: 24176411 Free PMC article.
-
Real-life effectiveness of 'improved' stoves and clean fuels in reducing PM2.5 and CO: Systematic review and meta-analysis.Environ Int. 2017 Apr;101:7-18. doi: 10.1016/j.envint.2017.01.012. Epub 2017 Jan 28. Environ Int. 2017. PMID: 28285622
-
Assessing Exposure to Household Air Pollution: A Systematic Review and Pooled Analysis of Carbon Monoxide as a Surrogate Measure of Particulate Matter.Environ Health Perspect. 2017 Jul 28;125(7):076002. doi: 10.1289/EHP767. Environ Health Perspect. 2017. PMID: 28886596 Free PMC article.
References
-
- WHO, 2023. Household air pollution. Fact sheet. 15 December, 2023. https://www.who.int/news-room/fact-sheets/detail/household-air-pollution... (accessed 5 Feb, 2024).
-
- Puzzolo, E. et al. Estimated health effects from domestic use of gaseous fuels for cooking and heating in high-income, middle-income, and low-income countries: a systematic review and meta-analyses. Lancet Respir. Med.10.1016/S2213-2600(23)00427-7 (2024). - PubMed
-
- Pathak, U., Gupta, N. C. & Suri, J. C. Risk of COPD due to indoor air pollution from biomass cooking fuel: a systematic review and meta-analysis. Int. J. Environ. Health Res.30(1), 75–88 (2020). - PubMed
-
- Younger, A., Alkon, A., Harknett, K., Louis, R. J. & Thompson, L. M. Adverse birth outcomes associated with household air pollution from unclean cooking fuels in low-and middle-income countries: a systematic review. Environmental research204, 112274 (2022). - PubMed
MeSH terms
Substances
LinkOut - more resources
Full Text Sources
Medical
