. 2025 Mar;27(3):493-504.
doi: 10.1038/s41556-025-01626-9. Epub 2025 Feb 26.

Decoding heterogeneous single-cell perturbation responses

Affiliations

Decoding heterogeneous single-cell perturbation responses

Bicna Song et al. Nat Cell Biol. 2025 Mar.

Abstract

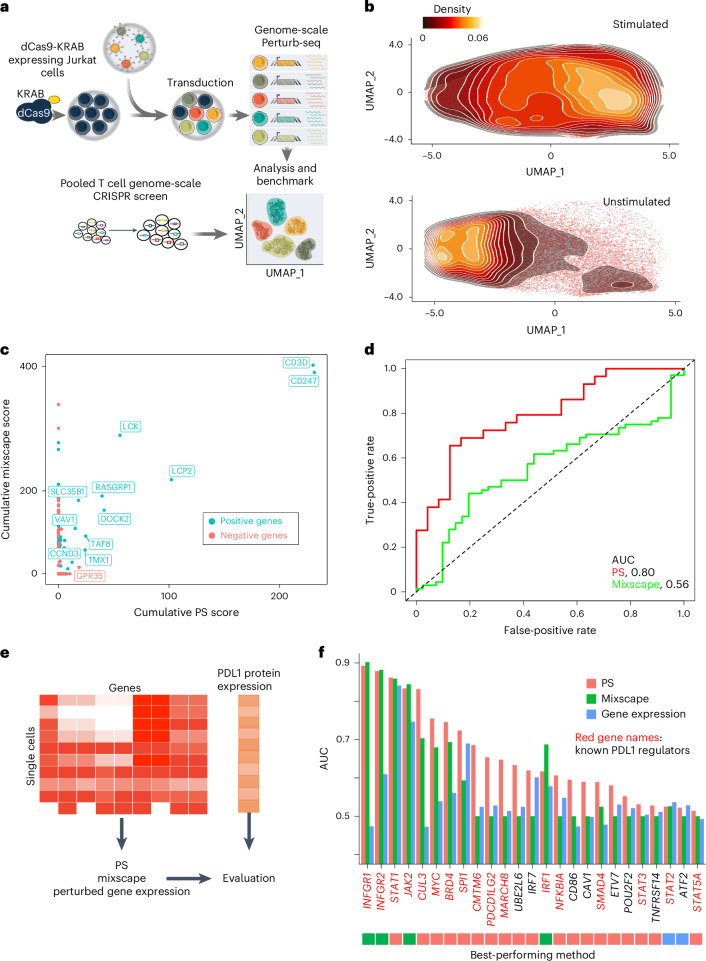
Understanding how cells respond differently to perturbation is crucial in cell biology, but existing methods often fail to accurately quantify and interpret heterogeneous single-cell responses. Here we introduce the perturbation-response score (PS), a method to quantify diverse perturbation responses at a single-cell level. Applied to single-cell perturbation datasets such as Perturb-seq, PS outperforms existing methods in quantifying partial gene perturbations. PS further enables single-cell dosage analysis without needing to titrate perturbations, and identifies 'buffered' and 'sensitive' response patterns of essential genes, depending on whether their moderate perturbations lead to strong downstream effects. PS reveals differential cellular responses on perturbing key genes in contexts such as T cell stimulation, latent HIV-1 expression and pancreatic differentiation. Notably, we identified a previously unknown role for the coiled-coil domain containing 6 (CCDC6) in regulating liver and pancreatic cell fate decisions. PS provides a powerful method for dose-to-function analysis, offering deeper insights from single-cell perturbation data.


Conflict of interest statement

Competing interests: T.B. is a cofounder and Managing Director of Myllia Biotechnology. A.K., A.V., N.U. and A.L. are employees of Myllia Biotechnology. The other authors declare no competing interests.

Figures

Fig. 1
Fig. 1. The PS framework and benchmark.
a, Overview of different technical and biological factors that contribute to heterogeneous perturbation outcomes from single-cell perturbation datasets. b, Using downstream gene expressions to infer the value of PSs. c, Overview of the PS estimation model.
Fig. 2
Fig. 2. Benchmark using synthetic and real datasets.
a, Benchmark results of both PS and mixscape using simulated datasets with different settings, including perturbation effects (25–100%) and different number of DEGs from bulk RNA-seq (Nelfb knockout versus WT). For each cell, its efficiency is correctly estimated if its absolute error is no more than 0.1; that is, ψtrueψpred<0.1, where Ψtrue is the true efficiency score and Ψpred is the estimated score. be, The score distribution of PS and mixscape using 50 DEGs and different values of true efficiencies: DE, 50; true efficiency, 25% (b), DE, 50; true efficiency, 50% (c), DE, 50; true efficiency, 75% (d) and DE, 50; true efficiency, 100% (e). Source numerical data are available in the source data. f, Benchmark pipeline using real CRISPRi-based Perturb-seq datasets, where perturbation efficiency is directly assessed through gene expression. gj, Benchmark results comparing PS and mixscape using a published Perturb-seq dataset. The numbers (and percentage) of genes with accurate efficiency estimation are defined by PCC < −0.1 and P value ≤0.05. The Perturb-seq experiments were conducted under low and high MOI conditions, where most cells express only one guide in low MOI and multiple guides in high MOI. The benchmark includes 23 in the low MOI dataset and 342 genes in the high MOI dataset. Correctly estimated genes in low MOI (g) and high MOI (h), and correctly estimated cells in low MOI (i) and high MOI (j). k, A representative gene (ACTB) where PS correctly estimated the efficiency of CRISPRi. A linear regression line is shown, and the shaded area indicates a 95% confidence interval of linear regression. PCC = −0.36, n = 54, and the associated Pearson’s test P value is P = 0.008. Source numerical data are available in the source data. DE, differential expression. Source data
Fig. 3
Fig. 3. Additional benchmarks using genome-scale Perturb-seq and ECCITE-seq.
a, Benchmark procedure using a genome-scale Perturb-seq and a published, pooled T cell CRISPR screen. b, The distribution of unstimulated and stimulated Jurkat cells along the UMAP plot. c, The correlation of predicted cumulative scores by PS and mixscape. The cumulative score of each gene is the sum of scores of that gene across all cells, and measures the relative contribution of perturbing each gene on affecting T cell stimulation. Positive and negative genes, identified from a published, genome-scale CRISPR screen on stimulated T cells, are marked in cyan and red, respectively. d, the ROC curve of both methods in separating positive and negative hits. e,f, Benchmark using a published ECCITE-seq where PDL1 protein expression is used as gold standard (e), and the performance of different methods in terms of predicting PDL1 protein expression (f). In f, red gene names indicate known PDL1 regulators. Source numerical data are available in the source data. Source data
Fig. 4
Fig. 4. Dose-dependent responses of perturbations.
a, The correlation between a gene’s PS and a phenotype of interest indicates positive (or negative) regulations. b,c, The correlation between PDL1 protein expression and the PS of STAT1 (b) and CUL3 (c). For STAT1 (b), PCC = −0.48, P = 7.95 × 10−27, n = 444 and for CUL3 (c), PCC = 0.44, P = 1.37 × 10−14, n = 274. The associated Pearson’s test was used to calculate P values when calculating PCC. CUL3 is a known negative regulator of PDL1, while STAT1 is a known positive regulator. d, The classification of buffered or sensitive genes using Hill equation. Here, the ED50 represents the dose (that is, perturbed gene expression) that reaches half of its maximal PS score. e, The classification of buffered or sensitive genes from published Perturb-seq datasets focusing on essential genes in K56232. f, The perturbation-expression plot of RPL5, a buffered gene. The fitted Hill curve and ED50 value are shown. g, The log fold changes of mark gene expressions (columns) on perturbing proteasome genes (rows) from the essential gene Perturb-seq dataset. Source numerical data are available in the source data. Source data
Fig. 5
Fig. 5. Perturb-seq on HIV latency.
a, The experimental design of Perturb-seq. b, The UMAP plot of single-cell transcriptome profiles. Cells are coloured by three different conditions. c, The distribution of BRD4 PS. d, The expression of HIV-GFP. e, The correlations between HIV-GFP expression and BRD4 PS that does not use HIV-GFP as the target gene. The PCC P values (calculated from Pearson’s test) are 1.40 × 10−65, 1.96 × 10−6, 6.26 × 10−29; n = 457, 179, 402 for DMSO, GFP and GFP+ conditions, respectively. The shaded area indicates a 95% confidence interval of locally estimated scatterplot smoothing regression. f, The distribution of CCNT1 PS. g, The protein expression of HIV-GFP in response to CCNT1 knockout in different cell states (TNF versus non-stimulated). Source numerical data are available in the source data. Source data
Fig. 6
Fig. 6. Pooled scRNA-seq on pancreatic differentiation.
a, Experimental design of multiplexing scRNA-seq on the knockout clones of different genes. b, The UMAP plot of single-cell transcriptome profiles, coloured by different clusters (left) or clones (right). c, The PS distribution of HHEX. d, The percentage of cells in PP/LV/DUO cell types from different clones. e, The correlations of CCDC6 PSs calculated from different cell types. The PCC is calculated from all cells with CCDC6 knockouts and is shown as numbers on the heatmap. f, Two different distribution patterns of CCDC6 PSs. g, The top enriched gene ontology terms of DEGs from PP/PP in transition. Enrichr was used to perform enrichment analysis and calculate the associated adjusted P value. h, The percentage of cells in PP/LV/DUO cell types from CCDC6 clones. i, The percentage of cells with PDX1+ (a PP marker) or HNF4A+ (a LV marker) by flow cytometry sorting. The data are based on two CCDC6 knockouts (KO1, KO2) and one WT control. For PDX1+, the adjusted P value for WT versus CCDC6 KO1 is 0.002 and for WT versus CCDC6 KO2 is 0.011. For HNF4A+, the adjusted P value for WT versus CCDC6 KO1 is 0.031 and for WT versus CCDC6 KO2 is 0.015. Three independent replicates are performed for each condition. The multiple comparison-adjusted P value is calculated by one-way analysis of variance test. *P < 0.05, **P < 0.01. Source numerical data are available in the source data. Source data
Extended Data Fig. 1
Extended Data Fig. 1. Benchmark different methods using simulated and real datasets.
a, Steps to generate simulated datasets using scDesign3 from a real scRNA-seq dataset that knocks out Nelfb gene. b-c, Benchmark results of different methods on another published CRISPRi-based Perturb-seq, where mismatches are introduced into guides to attenuate perturbation effects. The Area Under the Curve (AUC) values between the predicted scores and predicted sgRNA activities (b) and the Pearson Correlation Coefficient (PCC) values between the predicted scores of each method and the expressions of perturbed genes are reported for every perturbed (c), using the prediction methods provided in the original study. Source numerical data are available in source data. Source data
Extended Data Fig. 2
Extended Data Fig. 2. A genome-scale Perturb-seq.
a-b, The distribution of PS and mixscape predicted scores of top hits including CD247 (a) and LCK (b) in the pooled screen. c-d, The correlation between PSs and perturbed gene expression. For CD247 (c), PCC = -0.56, p = 0, n = 4,772, and for LCK (d), PCC = -0.46, p = 2.41e-140, n = 2,728. Source data
Extended Data Fig. 3
Extended Data Fig. 3. Predictions of PDL1 protein expression from a published ECCITE-seq dataset.
The figure displays the ROC curve (first panel), correlations between PS results and PDL1 protein expression (middle panel), and correlations between mixscape results and PDL1 protein expression (third panel) for each gene. The correlations are separated by cell classifications: NP (non-perturbed), defined as mixscape score <= 0.5, and KO (knockout), defined as mixscape score > 0.5. For a fair comparison, mixscape classification results were used to plot PSs (middle panel). For CUL3, the PCC p-values for PS are p = 1.63e-10 for NP cells and p = 8.28e-11 for KO cells, while for mixscape, the p-values are p = 0.57 for NP cells and p = 0.003 for KO cells. For IFNGR1, the PCC p-values for both PS and mixscape are p = 0 for both NP and KO cells. For MYC, the PCC p-values for PS are p = 0.011 for NP cells and p = 0.014 for KO cells, and for mixscape, the p-values are p = 0.849 for NP cells and p = 0.872 for KO cells. For BRD4, the PCC p-values for PS are p = 0.011 for NP cells and p = 0 for KO cells, while for mixscape, the p-values are p = 0.767 for NP cells and p = 0.054 for KO cells. Source numerical data are available in source data. Source data
Extended Data Fig. 4
Extended Data Fig. 4. Buffered genes and sensitive genes.
a, the mean expression and PS value, calculated for each of the 10 expression quantiles, are used for fitting the Hill equation in RPL5, a buffered gene. b, The distribution of PS scores within each of the 10 expression quantiles. c-e, The Hill equation curve and the distribution of PS score for HSPA5, a sensitive gene. f, A gene (BRD4) whose expression has no correlation with PS (p = 0.41). g-j, the log fold changes of gene expressions upon perturbing genes within the same protein complex, including ribosomal subunits (g), proteosome (from genome-scale Perturb-seq in Fig. 4a; h), RNA polymerase (i) and mediator complex (j). Data in g-j come from essential gene Perturb-seq. Source data
Extended Data Fig. 5
Extended Data Fig. 5. Characterization of BRD4-mediated transcriptional responses in HIV Perturb-seq.
a, The number of genes (nFeature_RNA), UMI counts (nCount_RNA) and the fraction of mitochondrial RNAs in three different conditions. b, Clustering results. c, Enriched Gene Ontology (GO) terms of cluster 8. d, The distribution of BRD4-targeting gRNAs. e, The expression distribution of BRD4 signature genes in cluster 8 vs other clusters (p = 4.63e-20). Only cells express BRD4-targeting gRNAs are included. f, Differential expression results between BRD4 PS+ cells vs BRD4 PS- cells. Source numerical data are available in source data. Source data
Extended Data Fig. 6
Extended Data Fig. 6. CCNT1’s Effect on HIV Transcription in Perturb-seq.
a, The distribution of CCNT1 mixscape score, calculated by mixscape. b, The expressions of CCNT1 (left) and CCNT1-targeting gRNAs (right). c, Differential expression results between CCNT1-targeting cells and non-targeting control cells in two different cell states. Dotted horizonal line indicates the position corresponding to adjusted p-val=0.001. d, The expressions of NFKB1. e, The quantitative perturbation-expression relationship between GFP and CCNT1 PS, similar with Fig. 6e. The PCC p-values (calculated from Pearson’s test) are 0.37, 5.9e-6, and 0.04 for DMSO, GFP- and GFP+ conditions, respectively. f, CD69 mRNA expression correlates with the continuous, stimulated state of T cells. g-j, distribution of PS values in CD247 (g) and PDCD1 (i), and the cumulative distribution PS, grouped by CD69 expression quantiles (h,j). Wilcox test p values for CD247 is 1.26e-51 and for PDCD1 is 1.3e-3. Source data
Extended Data Fig. 7
Extended Data Fig. 7. Cell type assignment based on known expression markers of different cell types in pancreatic differentiation scRNA-seq.
Cell types are assigned based on known expression markers in single-cell RNA-seq data from pancreatic differentiation. The figure shows the identification of various cell types using specific marker genes, helping to categorize different stages of pancreatic cell development.
Extended Data Fig. 8
Extended Data Fig. 8. DEG analysis.
a-b, The distribution of FOXA1 PSs across two different clones. c, The expression pattern of FOXA1. d-e, The DEG analysis results of CCDC6 knockout clones vs. wild-type clones in different cell types. f, Overlap of statistically significant DEGs (adj p < 0.05, |log2FC | >0.25) in DE and LV/DUO cell types.
Extended Data Fig. 9
Extended Data Fig. 9. Different CCDC6 functions.
a-b, The two patterns of CCDC6 PSs in LV/DUO (a) and DE in transition (b) cell types. c-d, The distribution of PS across different expression quantiles of POU5F1 (PCC = 0.22 p = 7.19e-66) and SOX17 (PCC = -0.19, p = 1.75e-46), two known factors that capture continuous cell state during DE in transition. For each gene, 5 expression quantiles are used, and 1 indicates the lowest expression quantile of that gene. e-h, Additional enriched terms using Enrichr on DEGs of CCDC6 knockout. i, Flow cytometry analysis of PDX1 and HNF4A expression upon CCDC6 knockout. One representative plot of three biological replicates is shown. Source data
Extended Data Fig. 10
Extended Data Fig. 10. Choosing the best parameters in PS and gating strategy.
a, The effect of the number of input genes in PS on the % correct cells in simulation datasets using different perturbation efficiencies and different number of DEGs. b, The effect of different lambda values on false positive rate. The false positive rates of different lambda values in two datasets are shown. c, Gating strategy for FACS sorting.

Update of

References

    1. Bock, C. et al. High-content CRISPR screening. Nat. Rev. Methods Primers2, 9 (2022). - PMC - PubMed
    1. Srivatsan, S. R. et al. Massively multiplex chemical transcriptomics at single-cell resolution. Science367, 45–51 (2020). - PMC - PubMed
    1. Dixit, A. et al. Perturb-seq: dissecting molecular circuits with scalable single-cell RNA profiling of pooled genetic screens. Cell167, 1853–1866.e17 (2016). - PMC - PubMed
    1. Adamson, B. et al. A multiplexed single-cell CRISPR screening platform enables systematic dissection of the unfolded protein response. Cell167, 1867–1882.e21 (2016). - PMC - PubMed
    1. Jaitin, D. A. et al. Dissecting immune circuits by linking CRISPR-pooled screens with single-cell RNA-seq. Cell167, 1883–1896.e15 (2016). - PubMed