. 2025 Feb 26;16(1):1980.
doi: 10.1038/s41467-025-57277-9.

PBRM1 directs PBAF to pericentromeres and protects centromere integrity

Affiliations

PBRM1 directs PBAF to pericentromeres and protects centromere integrity

Karen A Lane et al. Nat Commun. .

Abstract

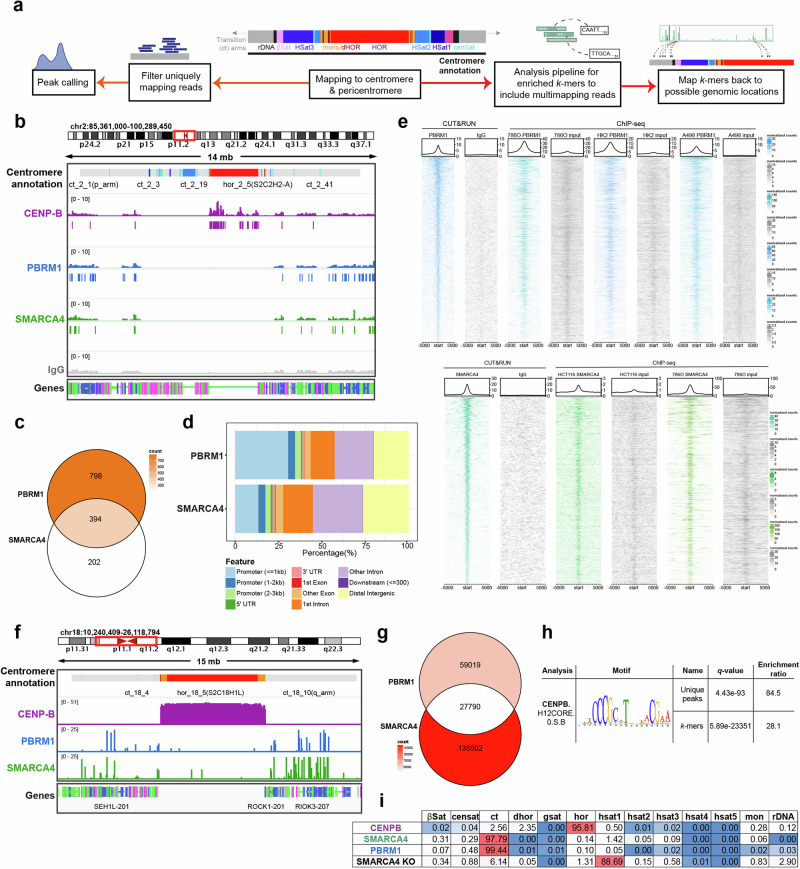
The specialised structure of the centromere is critical for effective chromosome segregation, but its repetitive nature makes it vulnerable to rearrangements. Centromere fragility can drive tumorigenesis, but protective mechanisms preventing fragility are still not fully understood. The PBAF chromatin remodelling complex is frequently misregulated in cancer, but its role in cancer is incompletely characterized. Here, we identify PBAF as a protector of centromere and pericentromere structure with profound consequences for genome stability. A conserved feature of isogenic cell lines lacking PBRM1, a subunit of PBAF, is compromised centromere and pericentromere integrity. PBAF is present at these regions, and binding patterns of PBAF and H3K9 methylation change when PBRM1 is absent. PBRM1 loss creates a dependence on the spindle assembly checkpoint, which represents a therapeutic vulnerability. Importantly, we find that even in the absence of any perturbations, PBRM1 loss leads to centromere fragility, thus identifying a key player in centromere protection.


Conflict of interest statement

Competing interests: The authors declare no competing interests.

Figures

Fig. 1
Fig. 1. Analysis of isogenic PBRM1 knockout (KO) cell lines identifies centromere associated protein misregulation as a common feature.
a Workflow for generation of PBRM1 knockouts in a panel of cell lines. Number of independent clones validated for each cell line is indicated at the bottom. bf Characterisation of PBRM1 knockouts using the hTERT-RPE1 cell line as an example. b Western blotting of whole cell lysates from parental and PBRM1 KO cells for PBRM1. α-tubulin is used as a loading control. c Scaled abundances of PBRM1 in proteomic analyses of whole cell protein extracts. Points correspond to independent biological replicates (n = 2). d Proliferation of RPE1 parental and two PBRM1 KO clones, measured using phase contrast Incucyte images (n = 2). e Cell cycle distribution of RPE1 parental and two PBRM1 KO clones measured using flow cytometry. n = 4, mean ± SEM, data were non-significant (ns) based on a 2way ANOVA using Dunnett’s multiple comparisons test. f Immunofluorescence images of nuclear morphology in RPE1 parental and PBRM1 KO clones. Scale bar corresponds to 40 µm. gi Protein abundances in PBRM1 knockouts compared to parental cells in hTERT-RPE1 (g), 1BR3-hTERT (h), and U2OS (i) cell lines, detected using LC-MS of whole cell protein extracts. The mean log2 fold change (Log2FC) of protein abundance in PBRM1 knockouts versus parental cells is plotted against the -log p value, calculated using two-sided one-sample t-test. PBRM1 is highlighted in red, while centromere- & pericentromere-associated proteins are highlighted in purple. j Schematic outlining regions of the centromere and pericentric heterochromatin, including the kinetochore in mitosis. k Median Log2FC of annotated centromere- & pericentromere-associated proteins in RPE1 PBRM1 knockouts compared to parental cells. l Transcript levels of annotated centromere- & pericentromere-associated genes corresponding to the proteins in k detected using RNA-seq. Median Log2FC of annotated genes transcribing centromere- & pericentromere-associated proteins in RPE1 PBRM1 knockouts was plotted compared to parental cells. Points in k and l correspond to individual knockout clones from two independent biological replicates. Source data are provided as a source data file.
Fig. 2
Fig. 2. PBRM1 KO cells display increased H3K9me3 intensity around centromeres.
a, b Quantification of the area of individual foci in cells stained for α-satellite centromeric regions in (a) chromosome 2 and (b) chromosome 10, using FISH probes. n = 3, coloured points represent median of biological replicates, line = median of 3 replicates, data were normalised to median area of parental cells and analysed using two-sided t-test of experiment medians, *p = 0.0338 **p = 0.0061. c Representative images of α-satellite FISH of chromosomes 2 and 10 in RPE1 parental and PBRM1 knockouts. Scale bars correspond to 20 µm; or 5 µm in inset images. d Quantification of H3K9me3 signal per nucleus normalised to median intensity of parental nuclei. Grey points correspond to individual nuclei. n = 4, coloured points represent median of biological replicates, line = median of 4 replicates. At least 325 nuclei were analysed per condition and data were analysed using two-sided t-test of experiment medians, *p = 0.0360. e Representative images showing H3K9me3 and CENP-A signal in RPE1 parental and PBRM1 KO cells. Scale bars correspond to 20μm. f Schematic describing the method of quantifying H3K9me3 signal around centromeres, which were defined by the presence of CENP-A. Briefly, a Cell Profiler pipeline was used to identify nuclei and CENP-A foci within each nucleus. CENP-A signal was expanded to a total distance of 4 µm from the centre of each CENP-A focus, and divided into 8 rings. H3K9me3 intensity was measured in each ring. g Boxplot indicating H3K9me3 intensity at increasing distances from the centre of CENP-A foci in RPE1 parental and PBRM1 KOs. Boxes contain the 25th to 75th percentiles with a line at median, and whiskers extend to the largest value no further than 1.5 times the inter-quartile range, n = 3. CENP-A foci in at least 290 nuclei quantified per condition and data were analysed using two-sided t-test of experiment medians corrected for multiple comparisons using the Holm-Sidak method (threshold = 0.05), *p = 0.0485 and *p = 0.0272 for 0.5 µm and 2.5 µm distances, respectively. Source data are provided as a source data file.
Fig. 3
Fig. 3. SMARCA4 is present at centromeres, and this pattern changes in PBRM1 KOs.
a Simplified flowchart describing the mapping strategy to centromeric and pericentromeric sequences (detailed version in Supplementary Fig. 6). b Representative genome tracks displaying coverage of reads from CENP-B (purple), PBRM1 (blue), SMARCA4 (green) and IgG control (grey) CUT&RUN sequencing in RPE1 parental cells across the centromere. c Venn diagram indicating the overlap of significantly enriched SMARCA4 and PBRM1 peaks in centromeric and pericentromeric regions in RPE1 parental cells. d Stacked colour bar representing the genomic distribution of enriched PBRM1 and SMARCA4 peaks, categorised by feature, within centromeric and pericentromeric regions. e CUT&RUN and ChIP-seq signal heatmaps (PBRM1 – top, blue; SMARCA4 – bottom, green) in the indicated cell lines +/−5kb from the centre of RPE1 PBRM1 or SMARCA4 CUT&RUN peaks in the centromere and pericentromere, versus the IgG or input control (grey) of each experiment. Peaks are ordered by signal of the left-most heatmap, i.e. CUT&RUN peaks. An average signal plot is shown at the top of each heatmap. f Representative genome tracks displaying mapping locations of enriched k-mers across the centromere and pericentromere from analysis of CENP-B (purple), PBRM1 (blue), and SMARCA4 (green) CUT&RUN sequencing in RPE1 parental cells. g Venn diagram indicating the overlap of enriched k-mers (FC > 2) in centromeric and pericentromeric regions, in SMARCA4 and PBRM1 in RPE1 parental cells. h CENP-B motif detection following motif analysis of CENP-B-enriched k-mers compared to a shuffled control, where CENP-B k-mer sequences were shuffled maintaining 3-mer frequencies. i Percentage of enriched k-mers that map to specific regions in the centromere and pericentromere in each dataset, including SMARCA4 k-mers enriched in SMARCA4 KO cells (negative control).
Fig. 4
Fig. 4. SWI/SNF enrichment at a subset of centromeric chromatin marks is altered in a PBRM1-dependent manner.
a Venn diagram indicating the overlap of significantly enriched peaks (top, orange) or k-mers (bottom, red) in the centromere and pericentromere, of SMARCA4 and PBRM1 in RPE1 parental cells, and SMARCA4 in PBRM1 knockout (KO) cells. Venn diagrams show enriched peaks or k-mers found in at least two of three independent biological replicates, versus their IgG controls. The colour corresponds to the total number of enriched peaks or k-mers in each region of the Venn diagram (count). b Representative genome tracks displaying coverage of reads from PBRM1 (blue), SMARCA4 (green), and IgG control (grey) CUT&RUN sequencing in RPE1 parental cells and SMARCA4 in PBRM1 knockout cells (light green), showing an example of peaks gained (left) or lost (right) in the PBRM1 knockout cells. One representative independent biological replicate is shown, with boxes underneath representing peaks that were called as significantly enriched (q < 0.01) in at least two of three replicates versus their IgG control. Genomic location is indicated at the top and centromeric annotation is shown above the tracks. c Schematic showing PBRM1 specific, PBRM1 non-specific and KO specific categories of peaks from CUT&RUN sequencing. Example graphics for called peaks are shown for each category. d CUT&RUN signal heatmaps representing the three categories of peaks in the centromere and pericentromere. Signal +/− 5 kb from the centre of each peak is shown for PBRM1 (blue) and SMARCA4 in parental RPE1 (green), SMARCA4 in PBRM1 knockout cells (light green), and IgG control (grey). Peaks are ordered by signal of the left-most heatmap for each condition. An average signal plot is shown at the top of each heatmap. e Stacked colour bar representing the genomic distribution of the three categories of peaks, categorised by feature, within centromere and pericentromere regions.
Fig. 5
Fig. 5. H3K9 methylation patterns in the centromere and pericentromeric regions are altered in the absence of PBRM1.
a Venn diagram indicating the overlap of significantly enriched H3K9me2 and H3K9me3 peaks in the centromere and pericentromere in RPE1 parental and PBRM1 knockout (KO) cells. b Representative genome tracks displaying coverage of reads from PBRM1 (blue), SMARCA4 (green), H3K9me2 (teal), H3K9me3 (orange) and IgG (grey) in RPE1 parental cells, and SMARCA4 (light green), H3K9me2 (light blue) and H3K9me3 (light orange) in PBRM1 KO cells. One representative independent biological replicate is shown, with boxes underneath representing peaks that were called as significantly enriched (q < 0.01) in at least two replicates versus their IgG control. c Venn diagram indicating the overlap of significantly enriched H3K9me2 and H3K9me3 k-mers in the centromere and pericentromere in RPE1 parental cells and PBRM1 knockout (KO) cells, versus the average IgG control. d Representative genome tracks displaying mapping locations of enriched k-mers across the centromere and pericentromere from analysis of H3K9me2 (teal) and H3K9me3 (orange) in RPE1 parental cells and PBRM1 KO cells (light blue and light orange, respectively). e Percentage of enriched k-mers that map to the transition arm (ct) or the HOR in parental and PBRM1 KO RPE1 cells, plotted as a heatmap, for H3K9me2 (left) and H3K9me3 (right). The colour scale of white to red represents low to high percentages, with specific percentages indicated. Venn diagrams show enriched peaks (a, orange) or k-mers (c, red) found in at least two out of the three independent biological replicates, versus their IgG controls. The colour corresponds to the total number of enriched peaks or k-mers in each region of the Venn diagram (count). For genome browser tracks (b,d), genomic location is indicated at the top, centromeric annotation is shown above the tracks and transcript annotation (Genes) is below.
Fig. 6
Fig. 6. PBRM1 KO cells are sensitive to mitotic perturbation.
a Clonogenic survival of RPE1 parental and PBRM1 knockouts treated with increasing doses of the CDK1 inhibitor RO-3306 relative to DMSO-only treated cells. n = 6, mean ± SEM, data were analysed using a 2way ANOVA with Dunnett’s test, **p = 0.0053, ***p = 0.0005. b Representative image from clonogenic survival assay in (a). c Experimental outline for quantifying nuclear defects induced following CDK1 inhibition by RO-3306. d % of cells with mild (left) or severe (right, also see panel f) nuclear defects after 24 h of treatment with DMSO (-) or RO-3306 (+). n = 4, mean ± SEM, data were analysed by 2way ANOVA with Dunnett’s test, ****p < 0.0001. 600-1500 nuclei were analysed per condition. e Representative images from d, showing nuclear morphology after 24 h of treatment with DMSO (-) or RO-3306 (+). Scale bar corresponds to 40 µm. f Quantification of types of severe nuclear morphology defects in parental or PBRM1 knockout cells treated as per the schematic in c. n = 4, mean ± SEM. g Clonogenic survival of RPE1 parental and PBRM1 knockouts following CCNB1 siRNA (si1 or si2) treatment, normalised to survival after treatment with a scramble (scr) siRNA. Points correspond to independent biological replicates, n = 3, mean ± SEM, data were analysed by 2way ANOVA with Dunnett’s test, ***p = 0.001 and ***p = 0.002 for KO1 and KO2, respectively. h Representative image from clonogenic survival assay in g. i Clonogenic survival of a panel of renal cell carcinoma (RCC) cell lines, which are PBRM1-proficient (blue) or -deficient due to loss-of-function mutations (red). Survival was measured after CCNB1 depletion with two independent CCNB1 siRNAs, normalised to survival after treatment with a scramble siRNA. Points correspond to independent biological replicates, n = 4 (RCC-FG2, Caki-1, RCC-4), n = 5 (786-O), or n = 8 (769-P, Caki-2). Boxes contain the 25th to 75th percentiles with line at median, and whiskers extend to 10th and 90th percentiles. j Western blotting for PBRM1 in RCC cell lines used in (i). α-tubulin is used as a loading control. k Representative images in PBRM1-proficient (786-O) and -deficient (RCC-FG2) cell line from the survival assay in (i). Source data are provided as a source data file.
Fig. 7
Fig. 7. PBRM1 KO cells display sensitivity to Mps1 inhibition in vitro and in vivo.
ac Clonogenic survival of RPE1 parental and PBRM1 knockout cells after treatment with increasing doses of the Mps1 inhibitors reversine (a), AZ3146 (b), and BOS172722 (c). Data shown are the mean ± SEM of 3 (b, c) or 4 (a) independent biological replicates, and data were analysed by 2way ANOVA with Dunnett’s test. In (a), *p = 0.0136, **p = 0.0025; in (b), **p = 0.0042 and **p = 0.0056 for KO1 and KO2, respectively; and in (c) *p = 0.0184, **p = 0.0023, and ***p = 0.0002. d Western blotting for PBRM1 in B16-F10 parental and PBRM1 knockout cells. Ponceau S staining shows total protein levels. e Median Log2FC of annotated pericentromere and centromere proteins using LC-MS of whole cell protein extracts in B16-F10 PBRM1 knockouts compared to parental cells. Points correspond to individual knockout clones from one of two independent biological replicates. f, g Clonogenic survival of B16-F10 parental and PBRM1 knockout cells after treatment with increasing doses of Mps1 inhibitors AZ3146 (f) and BOS172722 (g). n = 4 independent biological replicates, mean ± SEM, data were analysed by 2way ANOVA with Dunnett’s test. In (f), **p = 0.0043 and ****p < 0.0001; in (e), *p = 0.0405 and ***p = 0.0002. h Representative image from clonogenic survival assay in g. ik Kaplan-Meier survival curve showing survival of mice with tumours derived from (i) B16-F10 parental or (j, k) PBRM1 knockout cells, treated with vehicle (VEH) or BOS172722 (BOS). n = 9 mice per condition, and survival was compared using the logrank (Mantel-Cox) test, **p < 0.01. ln Area under the curve (A.U.C.) was calculated based on tumour growth up to the latest timepoint where all mice were still surviving in the indicated cell line; Day 21 for tumours derived from (l) B16-F10 parental and (m) PBRM1 KO2 cells, and Day 27 for (n) PBRM1 KO1 cells. n = 9 mice per condition, and significance was determined using an unpaired two-sided t-test, *p = 0.0374 and *p = 0.0296 for (m) and (n) respectively. Source data are provided as a source data file.
Fig. 8
Fig. 8. Loss of PBRM1 leads to centromere fragility.
a Quantification of the % of chromosomes in metaphases with sister chromatid exchanges (SCEs) in RPE1 parental or PBRM1 knockout cells. n = 5, grey points indicate individual metaphases, coloured points represent median of each biological replicate, line=median of replicates. At least 90 metaphases per cell line were analysed, two-sided t-test of medians showed no significant difference. b Quantification of the proportion of total SCEs which were intra-arm (grey) versus whole-arm (green) exchanges per metaphase, in RPE1 parental and PBRM1 knockout cells. Data are presented as median, n = 3. c Quantification of the % of chromosomes in metaphases with intra-arm (left) or whole arm (right) exchanges, corresponding to SCE data in a, analysed using unpaired two-sided t-test, *p = 0.0249, **p = 0.0035. d Representative images of metaphases in RPE1 parental and PBRM1 knockout cells stained with Giemsa to visualise intra-arm (purple arrows) or whole arm (green arrows) SCEs. Scale bar corresponds to 20 µm. Zoomed images show intra-arm (RPE1 parental) or whole arm (KO1 & KO2) SCEs, scale bar corresponds to 2 µm. e Schematic showing Cen-CO-FISH workflow, and methods of quantifying normal versus aberrant centromeres. Created in BioRender. f Representative metaphase spreads from Cen-CO-FISH experiments, with DNA (blue) stained with DAPI, and centromeres hybridised with FISH probes against the CENP-B box (Forward probe, green or Reverse probe, red). White arrows indicate aberrant centromeres. Scale bars correspond to 10 µm. Insets contain zoomed images of representative individual centromeres with scale bars corresponding to 2 µm. g Western blotting for CENP-A after treatment of RPE1 parental cells with either scramble or CENP-A siRNA for subsequent Cen-CO-FISH analyses. α-tubulin was used as loading control. h Quantification of SCEs at centromeres, defined as the percentage of chromosomes with aberrant centromeres in each metaphase spread (% abnormal mitoses). At least 49 metaphases were quantified for each condition. n = 3, grey points represent individual metaphases, coloured points represent median of each biological replicate, line=median of replicates, data were analysed using an unpaired two-sided t-test, *p = 0.0149 and *p = 0.0126 for CENP-A siRNA and KO1 conditions, respectively, **p = 0.0027. Source data are provided as a source data file.

References

    1. Altemose, N. et al. Complete genomic and epigenetic maps of human centromeres. Science376, eabl4178 (2022). - PMC - PubMed
    1. Chardon, F. et al. CENP-B-mediated DNA loops regulate activity and stability of human centromeres. Mol. Cell82, 1751–1767 e1758 (2022). - PubMed
    1. Muller, S. & Almouzni, G. Chromatin dynamics during the cell cycle at centromeres. Nat. Rev. Genet18, 192–208 (2017). - PubMed
    1. Barra, V. & Fachinetti, D. The dark side of centromeres: types, causes and consequences of structural abnormalities implicating centromeric DNA. Nat. Commun.9, 4340 (2018). - PMC - PubMed
    1. Balzano, E. & Giunta, S. Centromeres under pressure: evolutionary innovation in conflict with conserved function. Genes11, 10.3390/genes11080912 (2020). - PMC - PubMed

LinkOut - more resources