. 2025 Feb;638(8052):987-994.
doi: 10.1038/s41586-024-08544-0. Epub 2025 Feb 26.

Continued Atlantic overturning circulation even under climate extremes

Affiliations

Continued Atlantic overturning circulation even under climate extremes

J A Baker et al. Nature. 2025 Feb.

Erratum in

Abstract

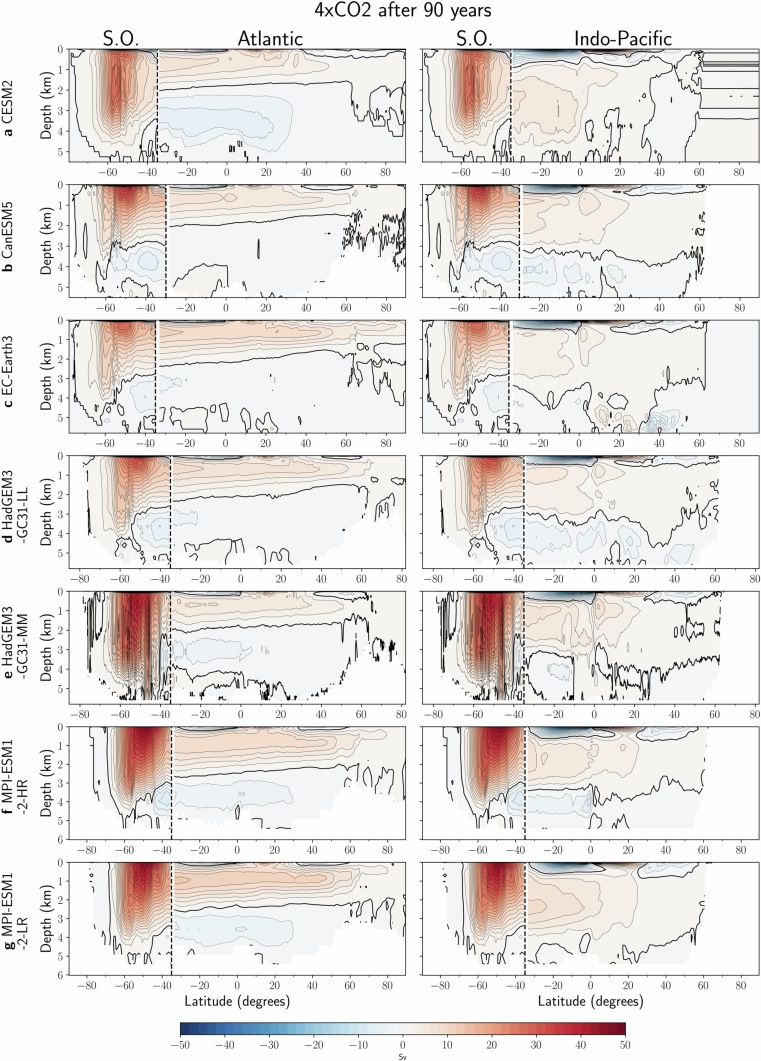
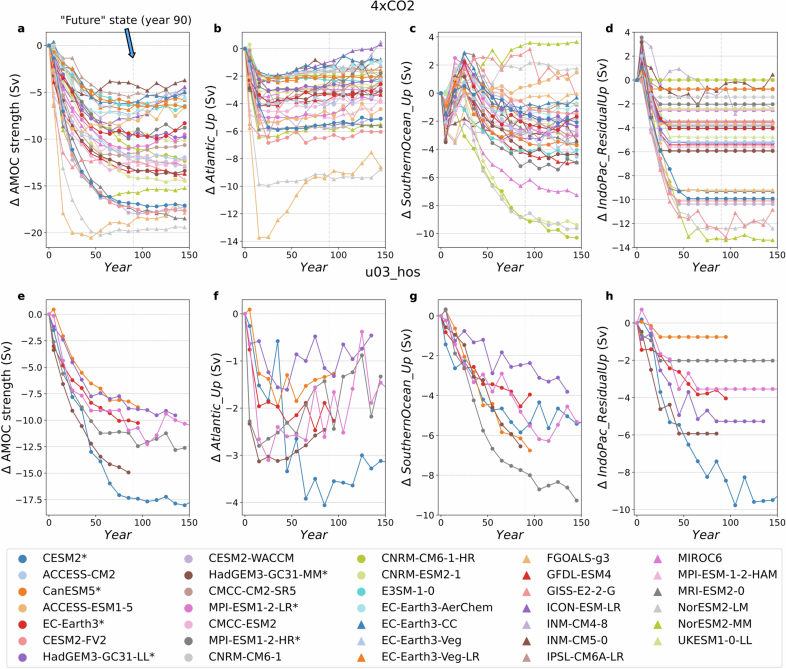
The Atlantic Meridional Overturning Circulation (AMOC), vital for northwards heat transport in the Atlantic Ocean, is projected to weaken owing to global warming1, with significant global climate impacts2. However, the extent of AMOC weakening is uncertain with wide variation across climate models1,3,4 and some statistical indicators suggesting an imminent collapse5. Here we show that the AMOC is resilient to extreme greenhouse gas and North Atlantic freshwater forcings across 34 climate models. Upwelling in the Southern Ocean, driven by persistent Southern Ocean winds, sustains a weakened AMOC in all cases, preventing its complete collapse. As Southern Ocean upwelling must be balanced by downwelling in the Atlantic or Pacific, the AMOC can only collapse if a compensating Pacific Meridional Overturning Circulation (PMOC) develops. Remarkably, a PMOC does emerge in almost all models, but it is too weak to balance all of the Southern Ocean upwelling, suggesting that an AMOC collapse is unlikely this century. Our findings reveal AMOC-stabilizing mechanisms with implications for past and future AMOC changes, and hence for ecosystems and ocean biogeochemistry. They suggest that better understanding and estimates of the Southern Ocean and Indo-Pacific circulations are urgently needed to accurately predict future AMOC change.


Conflict of interest statement

Competing interests: The authors declare no competing interests.

Figures

Fig. 1
Fig. 1. Schematic and analysis method for AMOC upwelling pathways.
a,b, Meridional overturning streamfunction in sverdrups (Sv (106 m3 s−1), with 2-Sv contour intervals) from the CMCC-ESM2 pre-industrial control simulation, highlighting the methodology for separating the AMOC’s upwelling pathways. Streamfunctions are shown for the Atlantic (a) and Indo-Pacific (b) oceans north of 34.5° S (indicated by vertical dashed lines) and globally within the Southern Ocean (SO). The 0-Sv streamline is marked by a solid black line and the vertical green line at 34.5° S in b denotes the net volume transport from the Indo-Pacific to the Southern Ocean over the highlighted depth. The coloured circles highlight the meridional overturning circulation strength at these locations. The term IndoPac_ResidualUp is calculated as a residual by rearranging the equation shown below the panels. c,d, Schematic of the AMOC’s upwelling pathways in the present day (c) and under scenarios of extreme GHG or North Atlantic freshwater forcing (d). Transport pathways are sketched, with increasing water mass density illustrated by a colour gradient from yellow to dark green.
Fig. 2
Fig. 2. SO upwelling sustains future AMOC strength.
ah Decadal-mean evolution of AMOC strength and upwelling pathways under extreme-forcing scenarios: abrupt quadrupling of CO2 (4xCO2; ad) and North Atlantic freshwater hosing (u03_hos; eh). Variables plotted are AMOC strength (a,e), and Atlantic (b,f), SO (c,g) and Indo-Pacific residual (d,h) upwelling pathways of the AMOC. The control simulation averaged over the first 50 years is plotted at year 0, with magnitudes under the forcing scenarios calculated in 10-year intervals. Models used in both the 4xCO2 and u03_hos scenarios are labelled with an asterisk.
Fig. 3
Fig. 3. PMOC emerges and SO overturning circulation changes under extreme forcing.
ad, Decadal-mean evolution in abrupt quadrupling of CO2 (4xCO2; a,b) and North Atlantic freshwater hosing (u03_hos; c,d,) forcing scenarios. Variables plotted are PMOC strength at 34.5° S (a,c) and SO upper cell strength at 34.5° S (b,d). Models used in both the 4xCO2 and u03_hos scenarios are labelled with an asterisk.
Fig. 4
Fig. 4. Future SO upwelling and PMOC strength determine future AMOC strength under extreme forcing.
af, Future (a,d) and control (b,e) SO upwelling pathways of the AMOC, and combination of future SO upper cell strength at 34.5° S and inverted future PMOC strength at 34.5° S, against future AMOC strength (c,f). The future state is 90 years into the 4xCO2 (ac) and North Atlantic freshwater hosing (u03_hos; df) forcing scenarios. A line of best fit across the whole ensemble, excluding outlying models shaded in orange (ac) and purple (c,f) is shown, with blue shading indicating the 95% confidence interval. A line of equality (dashed line) is also shown. Models shaded in red and green (b) show relatively strong and weak future AMOC strength, respectively.
Fig. 5
Fig. 5. Indo-Pacific and SO overturning changes drive changes in AMOC’s SO upwelling pathway under extreme forcing.
ad, Correlation of changes in the AMOC’s SO upwelling pathway with projected future PMOC strength at 34.5° S (a,c), and the combined effect of changes in SO upper cell strength at 34.5° S and inverted future PMOC strength at 34.5° S (b,d). Changes are between the control simulation and the future state 90 years after applying 4xCO2 (a,b) or North Atlantic freshwater hosing (u03_hos; c,d) forcing scenarios. A line of best fit across the whole ensemble (a,c), excluding outlying models shaded in purple (b,d), is shown, with blue shading indicating the 95% confidence interval. A line of equality (dashed line) is shown in b and d. Models shaded in red and green (a,b) have enhanced or greatly weakened future Southern Ocean upwelling pathways, respectively.
Fig. 6
Fig. 6. PMOC strength impacts AMOC decline under 4xCO2 forcing.
a,b, Aggregated contributions of each AMOC upwelling pathway—SouthernOcean_Up (orange), Atlantic_Up (blue) and IndoPac_ResidualUp (green)—to the AMOC strength (purple line) for a model that develops a weak (a) and a strong (b) PMOC at 34.5° S (black line). The SO upper cell strength at 34.5° S (red line) is also shown.
Extended Data Fig. 1
Extended Data Fig. 1. Overturning circulation in the pre-industrial control simulation.
Overturning streamfunction (Sverdrups (Sv); 2 Sv contour interval) in depth space averaged over the initial 50 years of the pre-industrial control experiment in the u03_hos subset of models, for the (left) Atlantic, and (right) Indo-Pacific Ocean north of 34.5°S (indicated by vertical dashed lines) and globally within the Southern Ocean (“S.O.”). The zero-streamline contour is defined by the solid black line.
Extended Data Fig. 2
Extended Data Fig. 2. Overturning circulation in the future state of the 4xCO2 experiment.
Overturning streamfunction (Sverdrups (Sv); 2 Sv contour interval) in depth space averaged over the 20-year period centred on year 90 of the 4xCO2 experiment in the u03_hos subset of models, for the (left) Atlantic, and (right) Indo-Pacific Ocean north of 34.5°S (indicated by vertical dashed lines) and globally within the Southern Ocean (“S.O.”). The zero-streamline contour is defined by the solid black line.
Extended Data Fig. 3
Extended Data Fig. 3. Overturning circulation in the future state of the North Atlantic freshwater forcing experiment.
Overturning streamfunction (Sverdrups (Sv); 2 Sv contour interval) in depth space averaged over the 20-year period centred on year 90 of the u03_hos experiment in the models available, for the (left) Atlantic, and (right) Indo-Pacific Ocean north of 34.5°S (indicated by vertical dashed lines) and globally within the Southern Ocean (“S.O.”). The zero-streamline contour is defined by the solid black line.
Extended Data Fig. 4
Extended Data Fig. 4. Overturning circulation in the future state of the 4xCO2 experiment in density space.
Overturning streamfunction (Sverdrups (Sv); 2 Sv contour interval) in density coordinates, using neutral density (γn) or density referenced to 2000 m (σ2) averaged over the 20-year period centred on year 90 of the 4xCO2 experiment in the five available models, for the (left) Atlantic, and (right) Indo-Pacific Ocean north of 34.5°S (indicated by vertical dashed lines) and globally within the Southern Ocean (“S.O.”). The zero-streamline contour is defined by the solid black line.
Extended Data Fig. 5
Extended Data Fig. 5. SO wind changes do not explain the intermodel spread in the SO overturning response to extreme GHG forcing.
Changes in (a) the magnitude and (b) the latitude of the maximum SO wind stress, against the change in SO upper cell strength at 34.5°S (future state minus control) in the 4xCO2 experiment. (c,d) The same as the upper panels, but using (c) the magnitude and (d) the latitude of the maximum SO Ekman transport.
Extended Data Fig. 6
Extended Data Fig. 6. Changes in overturning circulation after 90 years of North Atlantic freshwater forcing.
Differences in the overturning streamfuction change (2 Sv contour intervals) in depth space between the future state (average over the 20-year period centred on year 90) of u03_hos and the initial 50 years of the pre-industrial control experiment. The overturning circulation is plotted for the (left) Atlantic, and (right) Indo-Pacific Ocean north of 34.5°S (indicated by vertical dashed lines) and globally within the Southern Ocean (“S.O.”).
Extended Data Fig. 7
Extended Data Fig. 7. Changes in zonal-average SO surface buoyancy fluxes under 4xCO2 forcing.
Changes (future state minus control) in (a) net surface buoyancy fluxes (B_net) across 9 CMIP6 models and (b) multi-model mean of surface buoyancy flux components in the 4xCO2 experiment, including net heat (Q_net) and freshwater (FW_net) fluxes and their components - longwave (Q_LW) and shortwave (Q_SW) radiation, latent (Q_lat) and sensible (Q_sens) heat fluxes, precipitation (FW_precip), evaporation (FW_evap), and sea-ice freshwater (FW_ice) fluxes. A positive change indicates a tendency towards surface buoyancy gain. (c) Changes in the maximum positive SO buoyancy flux against changes in SO upper cell strength at 34.5°S in the 4xCO2 experiment.
Extended Data Fig. 8
Extended Data Fig. 8. The AMOC and its upwelling pathways change under extreme forcing.
Decadal-mean changes relative to the control are shown for a-d abrupt quadrupling of CO2 (“4xCO2”) and e-h North Atlantic freshwater hosing (“u03_hos”) forcing scenarios. Variables plotted are (a,e) AMOC strength, and (b,f) Atlantic, (c,g) Southern Ocean, and (d,h) Indo-Pacific residual upwelling pathways of the AMOC. Models used in both the 4xCO2 and u03_hos scenarios are labelled *.
Extended Data Fig. 9
Extended Data Fig. 9. Overturning circulation strength and AMOC upwelling pathways are similar in depth and density space.
(a,b) Differences (density space minus depth space) in these variables in a the control simulation and b the future state of the 4xCO2 experiment. (c-f) Decadal-mean evolution of (c) AMOC strength, and (d) Atlantic, (e) Southern Ocean, and (f) Indo-Pacific residual upwelling pathways of the AMOC in density space (Methods). The GFDL-ESM4 model is only plotted in a.
Extended Data Fig. 10
Extended Data Fig. 10. Localised South Atlantic overturning circulation can reduce SO upwelling of the AMOC.
(a,b) Meridional overturning streamfunction (Sverdrups (Sv); 2 Sv contour interval) from the GISS-E2-2-G pre-industrial control simulation, illustrating the method used to separate the AMOC’s upwelling pathways when the AMOC has a localised South Atlantic circulation that is isolated from the North Atlantic. Streamfunctions are shown for the Atlantic (a) and Indo-Pacific (b) Oceans north of 34.5°S (indicated by the vertical dashed line) and globally within the Southern Ocean (“S.O.”). The 0-Sv streamline is marked by a solid black line. The colored circles highlight the MOC strength at the highlighted location.

References

    1. Weijer, W., Cheng, W., Garuba, O. A., Hu, A. & Nadiga, B. T. CMIP6 models predict significant 21st century decline of the Atlantic Meridional Overturning Circulation. Geophys. Res. Lett.47, e2019GL086075 (2020).
    1. Bellomo, K., Angeloni, M., Corti, S. & von Hardenberg, J. Future climate change shaped by inter-model differences in Atlantic meridional overturning circulation response. Nat. Commun.12, 3659 (2021). - PMC - PubMed
    1. Baker, J. A. et al. Overturning pathways control AMOC weakening in CMIP6 models. Geophys. Res. Lett.50, e2023GL103381 (2023).
    1. Madan, G., Gjermundsen, A., Iversen, S. C. & LaCasce, J. H. The weakening AMOC under extreme climate change. Clim. Dyn.62, 1291–1309 (2023).
    1. Ditlevsen, P. & Ditlevsen, S. Warning of a forthcoming collapse of the Atlantic meridional overturning circulation. Nat. Commun.14, 4254 (2023). - PMC - PubMed

LinkOut - more resources