. 2025 Jul;32(7):1167-1174.
doi: 10.1038/s41594-025-01497-6. Epub 2025 Feb 26.

Cryo-EM structure of the human THIK-1 K2P K+ channel reveals a lower Y gate regulated by lipids and anesthetics

Affiliations

Cryo-EM structure of the human THIK-1 K2P K+ channel reveals a lower Y gate regulated by lipids and anesthetics

Karin E J Rödström et al. Nat Struct Mol Biol. 2025 Jul.

Abstract

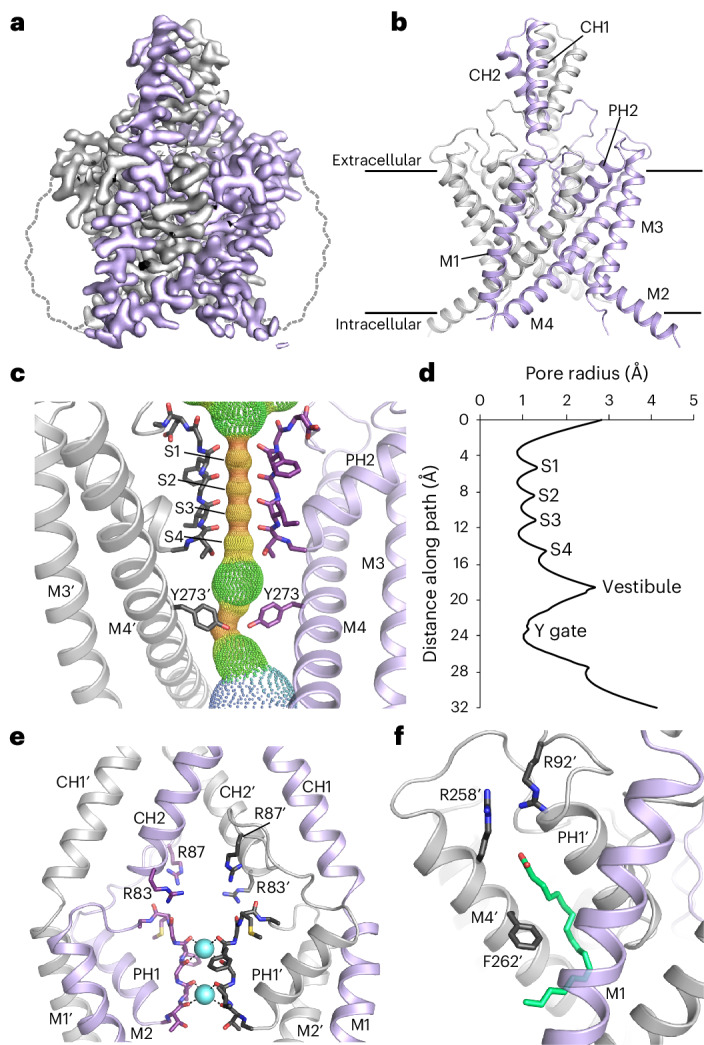
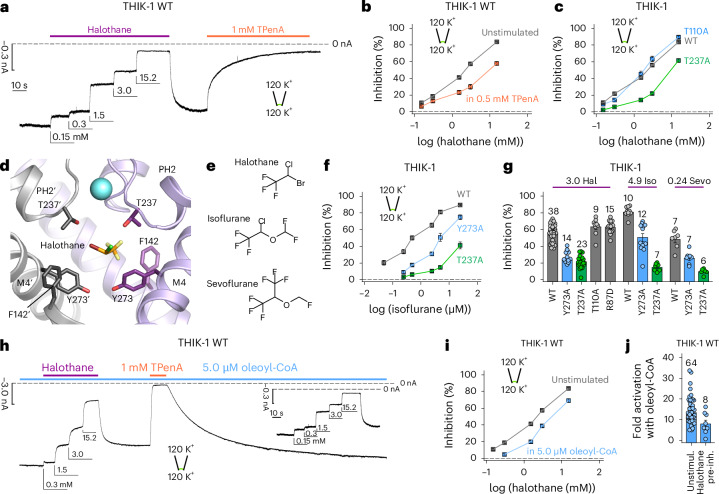
THIK-1 (KCNK13) is a halothane-inhibited and anionic-lipid-activated two-pore domain (K2P) K+ channel implicated in microglial activation and neuroinflammation, and a current target for the treatment of neurodegenerative disorders, for example Alzheimer's disease and amyothropic lateral sclerosis (ALS). However, compared to other K2P channels, little is known about the structural and functional properties of THIK-1. Here we present a 3.16-Å-resolution cryo-EM structure of human THIK-1 that reveals several distinct features, in particular, a tyrosine in M4 that contributes to a lower 'Y gate' that opens upon activation by physiologically relevant G-protein-coupled receptor and lipid signaling pathways. We demonstrate that linoleic acid bound within a modulatory pocket adjacent to the filter influences channel activity, and that halothane inhibition involves a binding site within the inner cavity, both resulting in conformational changes to the Y gate. Finally, the extracellular cap domain contains positively charged residues that line the ion exit pathway and contribute to the distinct biophysical properties of this channel. Overall, our results provide structural insights into THIK-1 function and identify distinct regulatory sites that expand its potential as a drug target for the modulation of microglial function.


Conflict of interest statement

Competing interests: A.R. is employed by Cerevance. The other authors declare no competing interests.

Figures

Fig. 1
Fig. 1. Structure of THIK-1.
a, Sharpened cryo-EM map viewed from the side with the density for THIK-1 channel subunits in gray and purple. The approximate position of the detergent micelle is outlined as a dashed gray line. b, Structure of THIK-1 colored as in a, with the M1–M4 transmembrane helices, and the pore and cap helices labeled. c, HOLE profile through the channel pore with the selectivity filter (S1–S4 sites) and the constriction formed by the lower tyrosine 273 (Y gate) site highlighted. For clarity, M1, M2 and PH1 have been hidden. d, Pore radius of the THIK-1 channel interior as a distance function along the ion-permeation pathway. e, Ion-exit pathway at the extracellular site of the selectivity filter is lined by a cluster of positively charged residues (R83 and R87 from both subunits). M3, M4 and PH2 have been hidden for clarity. f, The K2P modulator pocket, showing a lipid bound at the inter-subunit interface of M4, PH1 and M1. Key residues in close proximity are highlighted as sticks. Source data
Fig. 2
Fig. 2. THIK-1 Y gate regulated by lipids.
a, The Y gate viewed from the side (M2′ hidden for clarity) and from the bottom, showing that residue I139 is on the same horizontal level as Y273 and is part of the constriction formed by the Y gate. b, Relative whole-cell current amplitudes of WT THIK-1 and channels with substitutions in the Y gate. All currents (I) are normalized to that of the WT channel (IWT). c, Cell-attached recordings of 1-s duration at ±200 mV, containing single WT, I139S and Y273S THIK-1 channels, as indicated. The closed (c) and open channel (o) levels are shown. d, Comparison of single-channel open probability (Po) and single channel current amplitude (i) of WT, I139S and Y273S THIK-1 channels in cell-attached patches at −200mV. e, Representative macroscopic recording at −80 mV from an inside-out patch containing WT THIK-1 channels with symmetrical K+ concentrations (120 mM) at pH 7.4. Channel currents were activated by 5 µM oleoyl-CoA applied to the intracellular side of the membrane and then inhibited in a dose-dependent manner by TPenA. Inlay shows equal inhibition with TPenA at the unstimulated, basal state of the channels. f,g, Analysis of the affinity for TPenA from recordings in e, showing increased TPenA sensitivity after either oleoyl-CoA activation (f) or PIP2 activation (g). h, Analysis of TPenA kinetics for the block and release of WT THIK-1 in unstimulated and lipid-activated states. i,j, Analysis of apparent TPenA affinity (i) and kinetics (j) for WT and THIK-1 mutants from recordings as in the inlay in e. Throughout the graphs, all values are given as mean ± s.e.m., with the number of experiments or recordings (n) shown above the bars. Source data
Fig. 3
Fig. 3. Inhibition by volatile anesthetics involves both the filter and Y gate.
a, Representative recording at −80 mV from an inside-out patch containing WT THIK-1 channels with symmetrical K+ concentrations (120 mM) at pH 7.4. Channel currents were inhibited in a dose-dependent manner with increasing concentrations of halothane applied to the intracellular side of the membrane. Halothane effects can be washed and recovered and the currents inhibited with TPenA. b, Analysis of halothane inhibition for THIK-1 WT from recordings as in a, in the absence (gray) and presence (orange) of 0.5 mM TPenA, which produces an ~80 % block of initial currents. c, Analysis of halothane inhibition from recordings as in a for WT THIK-1 and indicated mutant channels. d, THIK-1 with halothane docked in the vestibule. Residues in close proximity are highlighted as sticks. For clarity, residues 121–138 in M2′ and PH2′ are not shown. e, Comparison of the structures of halothane, isoflurane and sevoflurane. f, Analysis of isoflurane inhibition of WT THIK-1, THIK-1-Y273A and THIK-1-T237A. All values are shown as mean ± s.e.m. (n ≥ 6 for each). g, Summary of volatile anesthetic inhibition with either 3.0 mM halothane, 4.9 mM isoflurane and 0.24 mM sevoflurane for WT THIK-1 and mutant channels as indicated. h, Representative recording under conditions as in a, showing dose-dependent halothane inhibition for THIK-1 channels activated with 5.0 µM oleoyl-CoA. i, Analysis of halothane inhibition in the absence and presence of 5.0 µM oleoyl-CoA from recordings as in a and h. j, Fold activation of WT THIK-1 with 5.0 µM oleoyl-CoA in the absence and presence of 15.2 mM halothane. Data are shown as mean ± s.e.m., with the number (n) of individual recordings indicated above the bars or in the legend. Unstimul., unstimulated; pre-inh., pre-inhibition. Source data
Fig. 4
Fig. 4. Regulation of THIK-1 activity by charged residues and lipids.
a, Bifurcated extracellular ion exit pathway for K+, showing the orientation of positively charged residues in that region (R83 and R87). b, Left: relative whole-cell current amplitudes of WT and mutant THIK-1 channels (R83D and R87D). Right: analysis of the single-channel i and Po from n ≥ 3 recordings, as shown in c for WT and mutant THIK-1 channels in cell-attached patches at −200 mV. c, Representative single-channel recordings of WT THIK-1 compared with channels for the R83D and R87D mutants. Recordings shown at ±200 mV in the cell-attached configuration. The closed and open channel levels are shown. d, Surface representation of THIK-1 and cutaway showing two linoleic acid molecules (green) in the curved lipid binding pocket. e, The density assigned to linoleic acid within this binding pocket is shown in green, with residues that have been altered for functional studies highlighted as sticks. f, Structural overlay of THIK-1 (purple) with TREK-2 (yellow), showing the position of F262 and Y102 in THIK-1, corresponding to W306 and F164 in TREK-2, which rotate during channel activation. Values are given as mean ± s.e.m., with the number (n) of individual recordings indicated above the bars. Source data
Extended Data Fig. 1
Extended Data Fig. 1. Cryo-EM processing pipeline for THIK-1.
a, The cryoEM construct (CC) used for structural studies remains functionally active; whole-cell currents (recorded at +50 mV) are normalised to WT THIK-1. All values are given as mean ± s.e.m with number (n) of individual recordings indicated above the bars. b, CryoEM imaging processing workflow. c, Local resolution estimation of the unsharpened map, determined within cryoSPARC. d, Gold standard FSC curve for resolution estimation, calculated within cryoSPARC. e, The sharpened map, overall views from the sides, bottom and slice through the top. Maps 2.6 Å around the M1-M4 helices and a close up view of the map in the lipid binding site.
Extended Data Fig. 2
Extended Data Fig. 2. Y-gating and TPenA inhibition in THIK channels.
a, Cell-attached recordings of 1 s duration at ± 100 mV containing single Y273S and Y273V THIK 1 channels, as indicated. The closed (c) and open channel (o) levels are indicated. b, Bottom view towards the selectivity filter with residues involved in TPenA binding highlighted. The K+ ion in the filter is represented in cyan. c, TPenA dose-response curves for WT (gray), T110A (blue) and V269 (green) mutant THIK-1 channels. TPenA IC50 values for WT and indicated mutants. d, Representative recording at −80 mV from an inside out patch of Xenopus oocyte expressing WT THIK-1 channels with symmetrical K+ concentrations (120 mM [K+]ext/120 mM [K+]int.) at pH 7.4. Channel currents were inhibited with 1 mM TPenA in the absence and presence of 5 µM oleoyl-CoA. e, Reduced GqPCR-mediated activation of Y273A mutant channels compared to WT THIK-1 (coexpressed with hM1R and activated by 10 μM Oxo-M). f, Representative recording from inside out patches containing either THIK-2* (gray trace) or THIK-2* Y292A channels (blue trace) with symmetrical [K+] (120 mM [K+]ext/120 mM [K+]int.) at pH 7.4. g, h, TPenA dose-response curves (f) and block/release kinetics (g) for THIK-2* (gray) and THIK-2* Y292A (blue) mutant channels, respectively. i, TPenA dose-response curves for WT (gray) and G331x mutant THIK-1 channels. Note, dashed line indicates TPenA dose-response curve for THIK-1 Y273A channels. All values are given as mean ± s.e.m with number (n) of individual recordings indicated above the bars. Source data
Extended Data Fig. 3
Extended Data Fig. 3. Volatile anaesthetic inhibition in THIK-1 channels.
a, Analysis of halothane inhibition of THIK-1 channel currents recorded at −80 mV from excised patches at pH 7.4 with low (4 mM) and high (120 mM) extracellular K+ indicating lack of effect of external [K+] which would otherwise displace a pore blocker. b, Surface representation and expanded cutaway of THIK-1 showing halothane docked off centre within the inner cavity. c, Analysis of sevoflurane inhibition for WT (gray), THIK-1 T237A (green) and Y273A mutant channels (blue), respectively. d, Analysis of halothane inhibition in the absence and presence of 5 µM oleoyl-CoA. e,f, THIK-1 with docked sevoflurane (e) or isoflurane (f) in the inner vestibule. For clarity, residues 121–138 in M2’ and PH2’ are not shown. K+ in the S4 site is shown as a cyan sphere. g, Confirmation of the predicted halothane binding pocket using MD-based docking. The binding site beneath the filter is indicated by the box and expanded on the right. Residues that contact halothane (HLT) are shown as cyan sticks and linoleic acid within the modulator site shown as VdW spheres. S4 represents T110 and T237 that form the S4 K+ binding site. Halothane is dynamic within this binding pocket and forms contacts with residues that include those identified by mutagenesis that affect halothane activation. The mean contact occupancy with halothane is indicated in the colour scale. All values shown in this figure are given as mean ± s.e.m with number (n) of individual recordings indicated above the bars. Source data
Extended Data Fig. 4
Extended Data Fig. 4. Role of positive charges in the cap domain.
a, Transparent surface representation of THIK-1 showing the cluster of arginine (blue) and lysine (purple) residues in the cap domain and at the intracellular pore site. b, Comparison of single-channel kinetics of THIK-1-R87D (top) and THIK-1 Y273S (bottom) recorded in cell-attached configuration at −100 mV. Traces represent 1 s recordings with horizontal dotted lines indicating the zero current level. Below the traces are dwell time histograms of openings (red bars), closings (green bars) and bursts of openings (blue bars). The lines are probability density function fits to the data: t1 = 0.31 ms, A1 = 611; t2 = 0.67 ms, A2 = 529; (openings); t1 = 0.14 ms A1 = 902; t2 = 0.58 ms, A2 = 136; t3 = 0.79 ms, A3 = 11; t4 = 14 ms, A4 = 13; t5 = 66 ms, A5 = 184; t6 = 185 ms; A6 = 42 (closings) and t1 = 0.23 ms, A1 = 36; t2 = 3.5 ms, A2 = 204 (bursts) for THIK-1 R87D, and t=0.33 ms, A=38900 (openings) and t1 = 0.17 ms A1 = 1914; t2 = 0.78 ms, A2 = 9500; t3 = 5.3 ms, A3 = 17613; t4 = 11 ms, A4 = 1695; t5 = 58 ms, A5 = 37; t6 = 300 ms; A6 = 3 (closings) and t1 = 0.12 ms, A1 = 7900; t2 = 0.59 ms, A2 = 22976 (bursts) for THIK-1-Y273S. c, Comparison of voltage-dependence of single-channel open probability (PO) and d, single-channel current amplitude (i) of THIK-1 R87D and THIK-1 Y273S mutant channels (All values are given as mean ± s.e.m, n ≥ 3). Note, lines through the data are drawn by hand. e, Cell-attached recordings of 1 s duration at voltages between −100 mV and +100 mV of single THIK-1 R87D and THIK-1 Y273S, as indicated. The dotted lines represent zero current levels. Source data
Extended Data Fig. 5
Extended Data Fig. 5. Mechanisms of halothane inhibition and lipid activation of THIK-1.
a,b, Analysis of halothane inhibition for WT and THIK-1 R87D mutant channels, respectively showing that the R87D channel retains similar sensitivity to WT THIK-1. c, Excised patch recordings of 1 s duration at −100 mV of single R87D THIK-1 channels in the absence (control) and presence of 0.4 % (upper panel) or 1% halothane (lower panel). The dotted lines represent zero current levels. Halothane induces destabilisation (shortening) of both open and closed states. Thus, because destabilisation of channel closings increases Po, then destabilisation of channel openings must drive the inhibitory effect of halothane. Consistent with this, higher concentrations of halothane (1% lower panel) induced a further, more dramatic reduction in the duration of openings, resulting in ‘flickery’ single-channel kinetics and an even greater decrease in channel Po (30% and 75% decrease in activity in the presence of 0.4% and 1% halothane, respectively. d, Representative recording from an inside out patch containing WT THIK-1 with symmetrical K+ concentrations (120 mM [K+]) at pH 7.4. Channel currents were activated with indicated concentrations of linoleic acid. e, Analysis of fold activations from recordings as in panel f for WT R92A and F262A mutants showing reduced effect on linoleic acid activation but no effect on oleoyl-CoA activation. All values shown in this figure are given as mean ± s.e.m with number (n) of individual recordings indicated above the bars or in the legend. f, EC50 values from dose-response curves as in panel e for WT and mutant THIK-1. g, Fold activation of WT and R92A and F262A mutant THIK-1 channels, respectively with either 30 µM linoleic acid or 5 µM oleoyl-CoA. Source data

References

    1. Enyedi, P. & Czirjak, G. Molecular background of leak K+ currents: two-pore domain potassium channels. Physiol. Rev.90, 559–605 (2010). - PubMed
    1. Niemeyer, M. I., Cid, L. P., Gonzalez, W. & Sepulveda, F. V. Gating, regulation, and structure in K2P K+ channels: in varietate concordia? Mol. Pharmacol.90, 309–317 (2016). - PubMed
    1. Mathie, A., Veale, E. L., Cunningham, K. P., Holden, R. G. & Wright, P. D. Two-pore domain potassium channels as drug targets: anesthesia and beyond. Annu. Rev. Pharmacol. Toxicol.61, 401–420 (2021). - PubMed
    1. Rajan, S. et al. THIK-1 and THIK-2, a novel subfamily of tandem pore domain K+ channels. J. Biol. Chem.276, 7302–7311 (2001). - PubMed
    1. Rifat, A. et al. Differential contribution of THIK-1 K+ channels and P2X7 receptors to ATP-mediated neuroinflammation by human microglia. J. Neuroinflammation21, 58 (2024). - PMC - PubMed

MeSH terms

LinkOut - more resources