. 2025 Jun;32(6):1050-1060.
doi: 10.1038/s41594-025-01490-z. Epub 2025 Feb 26.

Local structural flexibility drives oligomorphism in computationally designed protein assemblies

Affiliations

Local structural flexibility drives oligomorphism in computationally designed protein assemblies

Alena Khmelinskaia et al. Nat Struct Mol Biol. 2025 Jun.

Abstract

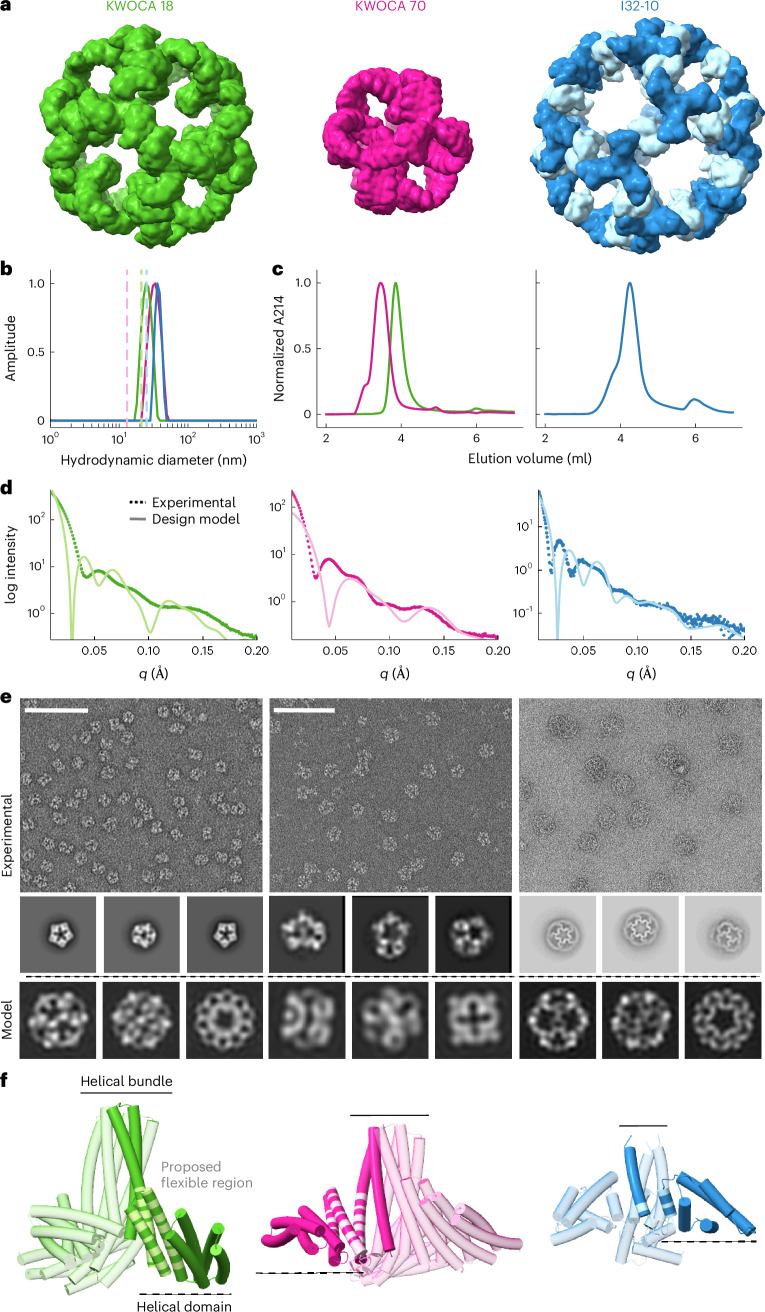
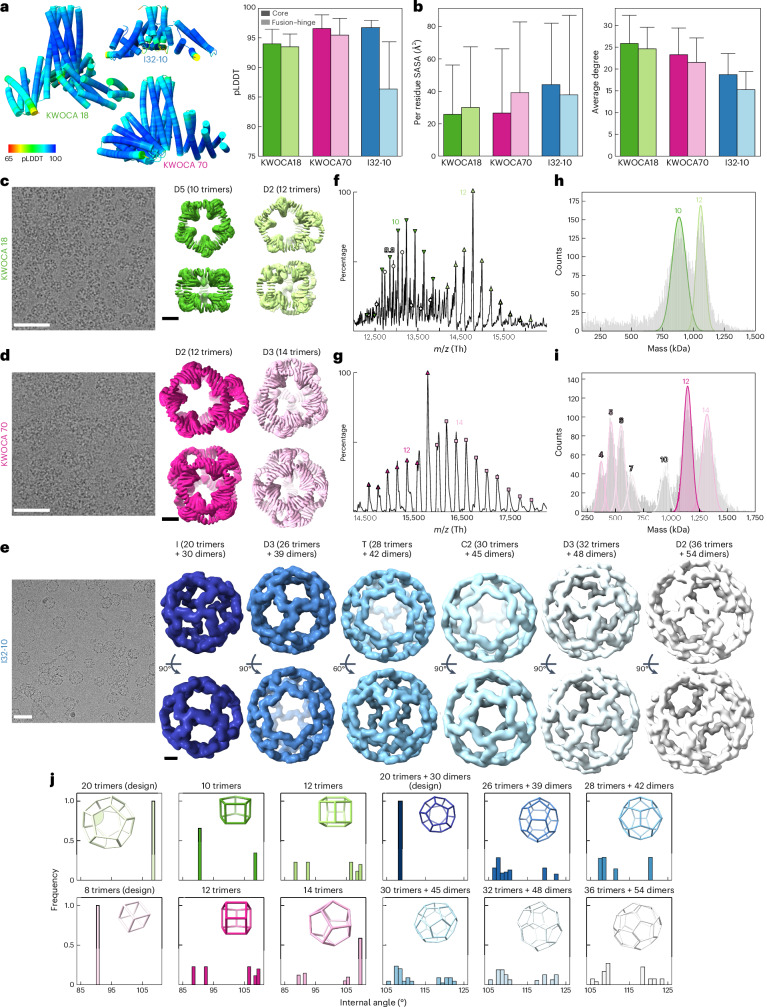
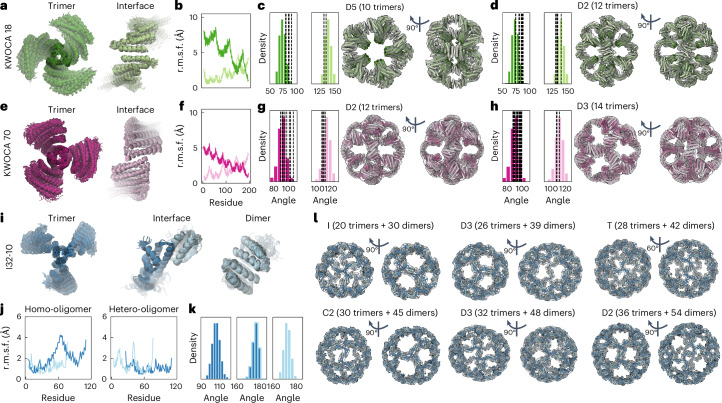
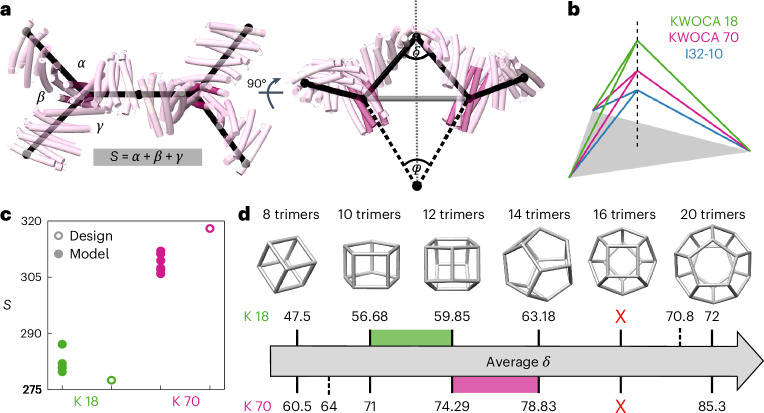
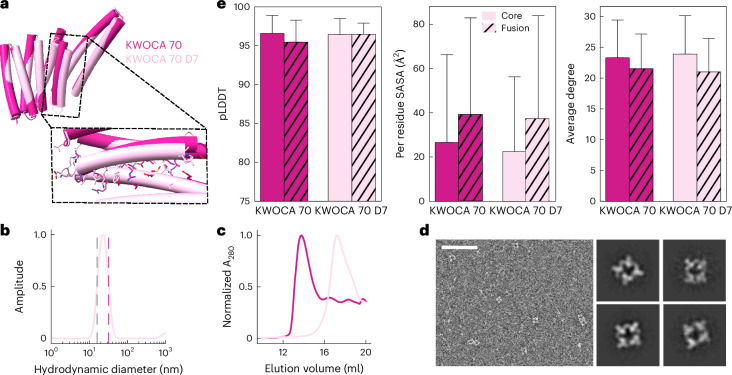
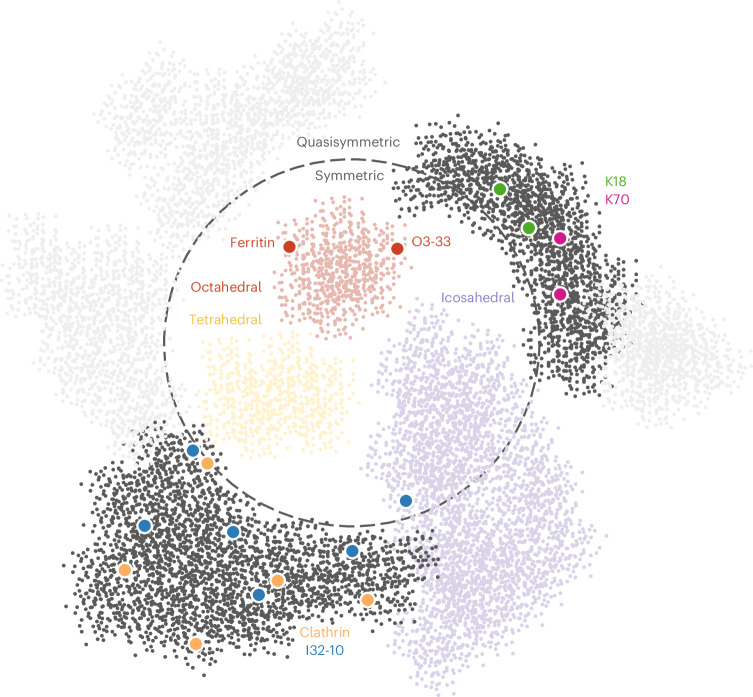
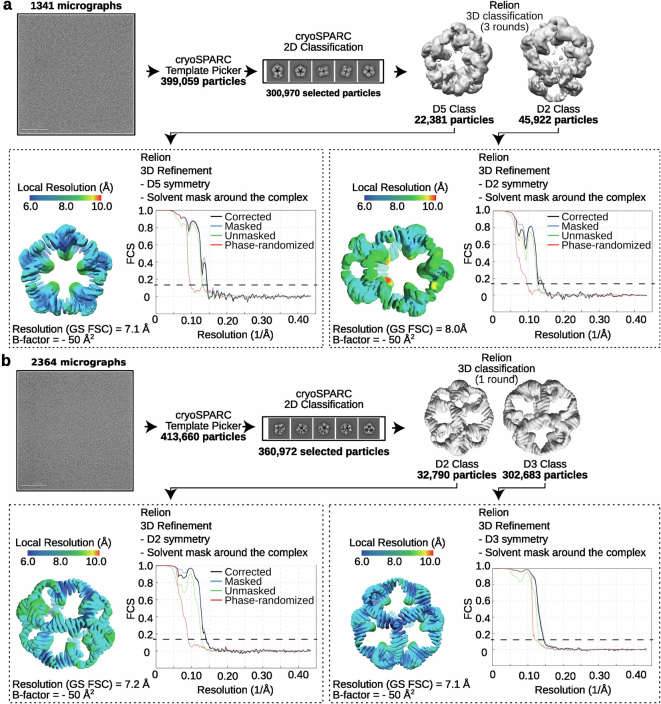
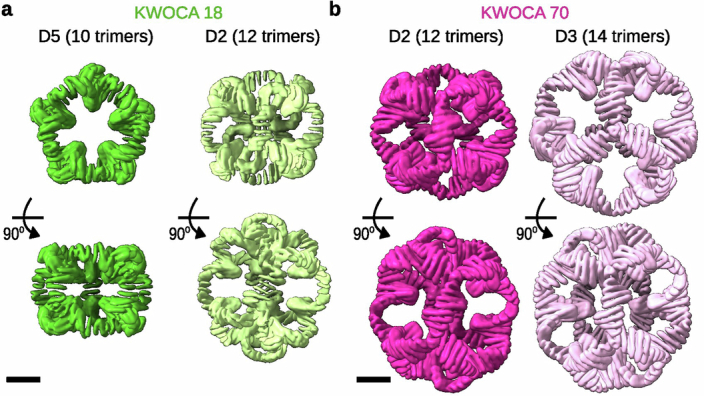
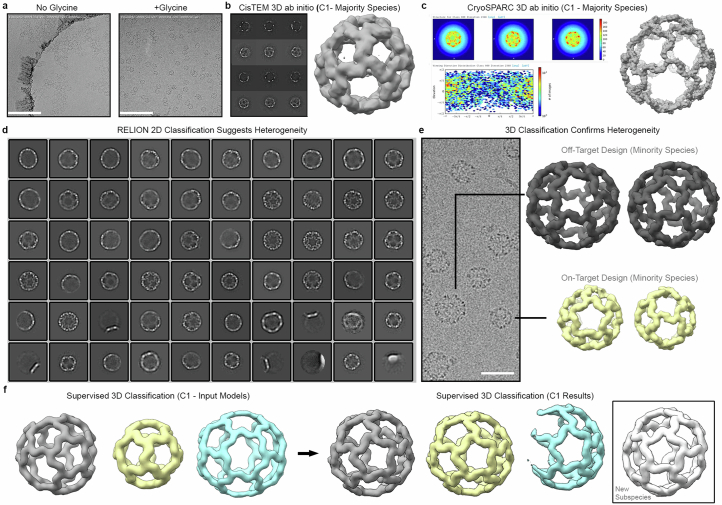
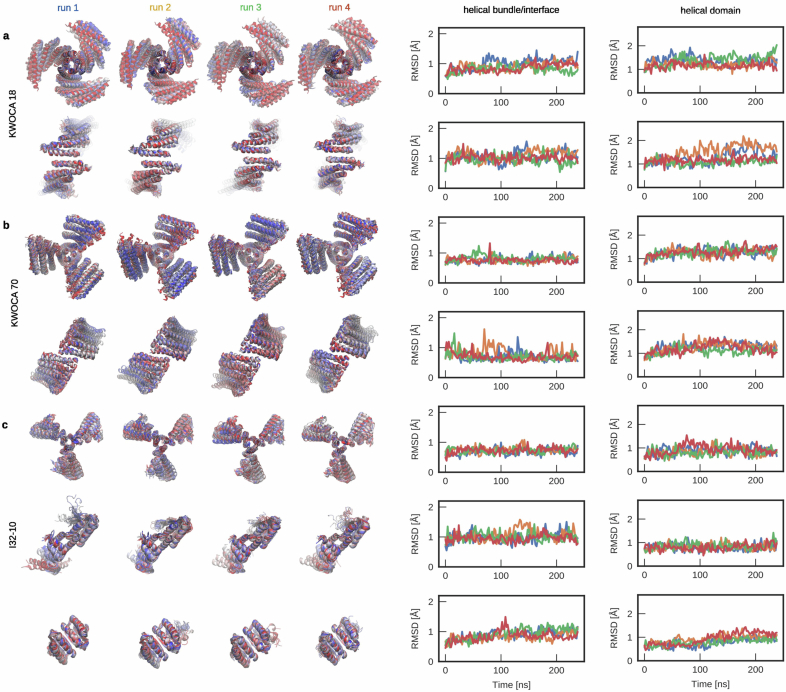
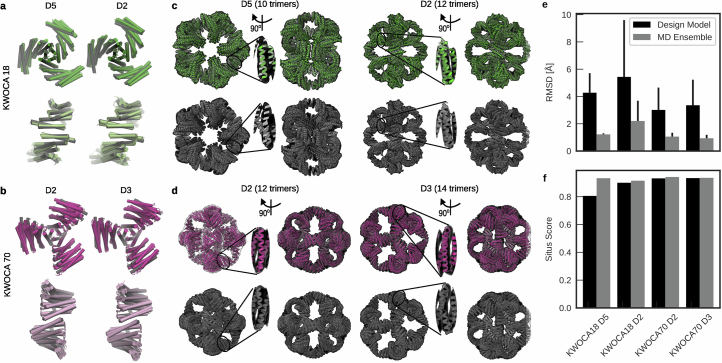
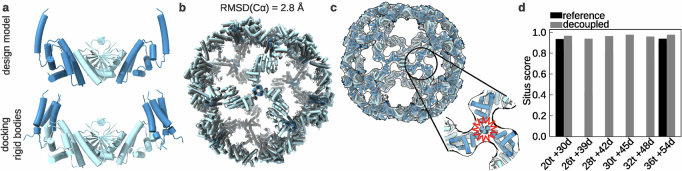
Many naturally occurring protein assemblies have dynamic structures that allow them to perform specialized functions. Although computational methods for designing novel self-assembling proteins have advanced substantially over the past decade, they primarily focus on designing static structures. Here we characterize three distinct computationally designed protein assemblies that exhibit unanticipated structural diversity arising from flexibility in their subunits. Cryo-EM single-particle reconstructions and native mass spectrometry reveal two distinct architectures for two assemblies, while six cryo-EM reconstructions for the third likely represent a subset of its solution-phase structures. Structural modeling and molecular dynamics simulations indicate that constrained flexibility within the subunits of each assembly promotes a defined range of architectures rather than nonspecific aggregation. Redesigning the flexible region in one building block rescues the intended monomorphic assembly. These findings highlight structural flexibility as a powerful design principle, enabling exploration of new structural and functional spaces in protein assembly design.


Conflict of interest statement

Competing interests: The authors have patent filings to disclose: J.Y.(J.)W., A.K., D.B. and N.P.K. are coinventors on patent applications (International patent application PCT/US2023/065397 (2023) and US provisional patent application 63/328,394 (2022)) related to this work. The other authors declare no competing interests.

Figures

Fig. 1
Fig. 1. Computationally designed self-assembling proteins occasionally present large deviations from the intended architecture.
a, Design models of the de novo one-component assemblies KWOCA 18 and KWOCA 70 (ref. ) and the two-component assembly I32-10 (ref. ). be, DLS (b), SEC traces (c), SAXS profiles (d) and nsEM micrographs and representative 2D class averages (e) obtained for each design. Hydrodynamic diameters, SAXS profiles and 2D projections calculated from the computational design models are shown in light color in b, d and e. Scale bars in e, 50 nm. Each measurement was repeated at least three independent times. f, Representation of the two-domain structure of each trimeric building block. One subunit of each trimer is shown in a darker shade with the regions proposed to be structurally flexible highlighted in light color.
Fig. 2
Fig. 2. Oligomorphic assemblies of KWOCA 18, KWOCA 70 and I32-10.
a,b, AlphaFold2 multimer predictions (a) and Rosetta-calculated SASA and average degree (b) suggest that the hinge regions hypothesized to be flexible are under-packed. Average per-residue values with standard deviation for the regions defined in Extended Data Table 1 are plotted. ce, Cryo-EM micrographs and density maps obtained for KWOCA 18 (c), KWOCA 70 (d) and I32-10 (e). The number of building blocks making up each assembly and its overall symmetry are indicated above each density map. Scale bars: cryo-EM micrographs, 50 nm; density maps, 5 nm. fi, Native MS (f,g) and charge detection mass spectra (h,i) obtained for KWOCAs 18 (f,h) and 70 (g,i). Each peak is labeled with a symbol indicating the number of trimers in the corresponding assembly species. j, Distributions of internal angles in wireframe representations of the expected and observed assemblies. Wireframe assemblies are colored as in ce, and an example internal angle is indicated for the designed icosahedral assembly of KWOCA 18.
Fig. 3
Fig. 3. Local structural flexibility is a key driver of oligomorphism.
Overlaid molecular dynamics trajectories obtained for trimeric (dark) and dimeric (light) building blocks and the interfaces between them (a,e,i), respective root mean square fluctuations (r.m.s.f.) (b,f,j), internal angle distributions (c,d,g,h,k) and assembly models (c,d,g,h,l) for each observed species for KWOCA 18 (ad), KWOCA 70 (eh) and I32-10 (il). Internal angles within the molecular dynamics trajectory snapshots used to build the KWOCA 18 and KWOCA 70 models are highlighted with dashed lines in the respective angle distributions in c,d,g,h.
Fig. 4
Fig. 4. Landscapes of possible polyhedral architectures accessible to each flexible building block.
a, Hypothetical KWOCA architectures can be described by the sum of internal angles between the subunits of the trimer, S (left) and the dihedral angle δ at the interface between neighboring trimers (right). The internal angle between neighboring local threefold symmetry axes, φ, is characteristic of each polyhedral architecture. b, The trimer subunits of KWOCA 18, KWOCA 70 and I32-10 (shown for comparison) differ in S. c, The multiple values of S observed experimentally for KWOCAs 18 and 70, compared to the single values of the perfectly symmetric design models, highlight the flexibility of these proteins. d, The average δ necessary to obtain each architecture is shown. Green and pink ranges highlight the regime in the experimentally observed architectures. The 16-trimer architecture cannot be formed without extreme asymmetry (that is, θ values well beyond the experimentally observed ranges). The dashed lines indicate the δ of the design models for KWOCA 18 (20 trimers) and KWOCA 70 (eight trimers). In both cases, S is outside the range of the experimentally observed architectures.
Fig. 5
Fig. 5. Redesign of the flexible junction region of KWOCA 70 recovers monomorphic octahedral assemblies.
a, Model of an individual subunit of KWOCA 70 D7, highlighting changes relative to the original KWOCA 70 design at both the backbone and sequence levels. bd, DLS (b), SEC traces (c) and nsEM (d) representative 2D class averages for KWOCA 70 D7. The hydrodynamic diameter calculated from the computational design model is shown in gray in b, while the experimentally observed diameter of KWOCA 70 is shown in dark pink. Scale bar in d, 100 nm. e, AlphaFold2 multimer confidence prediction (pLDDT), but not Rosetta-calculated SASA and average degree, suggest packing improvements in the junction region of KWOCA 70 D7. Average per-residue values with standard deviation for the regions defined in Extended Data Table 1 are plotted.
Fig. 6
Fig. 6. Assembly space of quasisymmetric architectures.
Each point represents a hypothetical sequence–structure pair. Points are clustered to represent different types of architecture. Ferritin and O3-33 are provided in the fully symmetric assembly space as examples of natural and designed self-assembling proteins with octahedral symmetry. KWOCAs 18 and 70 and I32-10 form multiple distinct architectures, as indicated by the several highlighted points for each. For comparison, we highlight clathrin, which shares multiple architectures with I32-10. The unbounded nature of the quasisymmetric space represents the essentially infinite possible architectures.
Extended Data Fig. 1
Extended Data Fig. 1. Cryo-EM acquisition and analysis pipeline for both KWOCA assemblies.
Raw micrographs, representative 2D class averages, 3D classes, local resolution estimation maps, and FSC curves corresponding to the cryo-EM densities for (a) KWOCA 18 and (b) KWOCA 70 in Fig. 2.
Extended Data Fig. 2
Extended Data Fig. 2. Cryo-EM density maps obtained for the KWOCA 18 and 70 assemblies.
Orientations highlighting the (top) cyclic and (bottom) dihedral symmetry axes of each (a) KWOCA 18 and (b) KWOCA 70 assembly are provided in addition to those shown in Fig. 2c,d to highlight the different pores found in each architecture.
Extended Data Fig. 3
Extended Data Fig. 3. Cryo-EM insights into I32-10 assembly diversity.
(a) Representative raw micrographs illustrate the I32-10 sample embedded within vitreous ice. The introduction of 100 mM glycine prior to freezing, across three separate instances, effectively mitigated flocculation and aggregation, facilitating downstream data processing to analyze distinct I32-10 assembly states. Movies were acquired across two experimental replicates from samples containing 100 mM glycine for subsequent high-resolution analysis. (b) 3D ab initio reconstructions (C1 symmetry) in cisTEM unveiled a tetrahedral configuration adopted by the majority of I32-10 nanoparticles. (c) Independent C1 3D ab initio reconstructions in CryoSPARC further validated the tetrahedral assembly as the majority I32-10 species. (d) Relion 2D class averages highlighted remarkable heterogeneity in I32-10, encompassing variations in size and geometry. (e) Raw micrographs and subsequent 3D classification in Relion confirmed the existence of diverse off-target and on-target assembly states, consistent with the observations from 2D class averages. (f) An overview of the iterative 3D classification pipeline, as detailed in the Methods section. Supervised 3D classification jobs utilized heavily low-pass-filtered starting models, occasionally leading to the discovery of novel subspecies in output models. Scale bars: (a) 200 nm; (e) 50 nm.
Extended Data Fig. 4
Extended Data Fig. 4. Mass spectrometry confirms coexistence of multiple species for KWOCAs 18 and 70.
(a) Comparison between the (top) experimental and (bottom) simulated native mass spectra from Fig. 2f,g. A 0.5:1:1.25 ratio of 9.3-, 10-, and 12-trimer assemblies was used in the simulation for KWOCA 18, and a 1:1.25 ratio of 12- and 14-trimer assemblies for KWOCA 70. (b) Tandem mass spectra by higher-energy collisional dissociation (HCD) with isolation m/z ranges of (left) 12,500-13,500 and (right) 14,500-15,500 for KWOCA 18, and isolation m/z ranges of (left) 15,000–16,000 and (right) 16,500–17,500 for KWOCA 70. (c) Conventional native mass spectra with lower m/z ranging from 4,500–10,000 and 4,000–14,500 for KWOCAs 18 and 70, respectively. The inset shows both 2D and 1D spectra of the deconvoluted masses from co-occurring low mass species.
Extended Data Fig. 5
Extended Data Fig. 5. Integrity of protein building blocks, interfaces, and domains along simulated MD trajectories.
Overlay of individual 240 ns trajectories (blue to red) for (top) the trimeric building block and (bottom) the interface between neighboring trimers, as well as RMSD analysis of each domain (see Fig. 1f) along the trajectories (helical bundle/interface vs. helical domain) for (a) KWOCA 18 and (b) KWOCA 70. (c) For I32-10, 240 ns trajectories for the (top) trimer, (middle) dimer, and (bottom) dimer-trimer interface (blue to red) and (right) RMSD analysis for each domain along the trajectories are shown.
Extended Data Fig. 6
Extended Data Fig. 6. Inherent structural flexibility is sufficient to build high-quality models of the observed assemblies.
(a,b) Overlay of the snapshots used to build each model for KWOCAs 18 and 70, respectively. Rigid bodies extracted from the design models are colored in grey. In addition to full snapshots (left), overlays of all individual chains aligned to the helical bundle or the protein interface are shown to highlight the flexibility in the fusion region (right). (c,d) Models built by fitting (top row, color) snapshots extracted from the MD trajectories or (bottom row, grey) rigid bodies extracted from the design models into the experimental cryo-EM density maps for KWOCAs 18 and 70, respectively. Insets highlight regions where the fits of the MD snapshots are clearly superior to those from the design models. (e) RMSDs between fitted trimeric and dimeric building blocks at the stitching region where the bars represent the maximum value (see Methods for details) and (f) the overall fit of the model to the cryo-EM density using rigid bodies from the design model or snapshots from the MD trajectories both highlight the higher quality of the models constructed from the MD snapshots.
Extended Data Fig. 7
Extended Data Fig. 7. Allowing flexibility in the hinge region of the I32-10 trimer during docking renders plausible models of observed I32-10 assemblies.
(a) Comparison of (top) the design model with (bottom) the rigid bodies used for two-step docking into the experimental cryo-EM density maps. In the latter, the trimeric scaffold was cropped so that the helical bundle, which occupies the vertices of each architecture (dark blue), can be treated as a separate rigid body from the helical domains that form protein-protein interfaces with the dimeric scaffold (light blue). The entire light blue region in the bottom image, comprising the dimer with both neighboring helical domains from the trimer, was used as a single rigid body during docking. (b) Overlay of the I32-10 icosahedral design model (grey) with the corresponding built model (blue). (c) Example of a fit using a single rigid body derived from the design model into the D2 architecture (36 trimers + 54 dimers) cryo-EM density. The resulting model generates clashes at the center of the helical bundle (highlighted in red). (d) Situs metric95 for the built models. Models for the icosahedral (20 trimers + 30 dimers) and D2 (36 trimers + 54 dimers) architectures constructed using each method are compared.
Extended Data Fig. 8
Extended Data Fig. 8. Asymmetric adjustment of individual subunits in a trimer.
(a) The angle θ quantifies the asymmetric adjustment of the trimer. (b) The values of θ in the cryo-EM models of KWOCAs 18 and 70 compared to the designed structures. The multiple angles observed experimentally for θ is one indicator of the quasisymmetry observed in these systems.

Update of

Similar articles

Cited by

  • Interface flexibility controls the nucleation and growth of supramolecular networks.
    Caroprese V, Tekin C, Cencen V, Mosayebi M, Asmari N, Liverpool TB, Woolfson DN, Fantner GE, Bastings MMC. Caroprese V, et al. Nat Chem. 2025 Mar;17(3):325-333. doi: 10.1038/s41557-025-01741-y. Epub 2025 Feb 13. Nat Chem. 2025. PMID: 39948282 Free PMC article.
  • Atomically accurate de novo design of antibodies with RFdiffusion.
    Bennett NR, Watson JL, Ragotte RJ, Borst AJ, See DL, Weidle C, Biswas R, Yu Y, Shrock EL, Ault R, Leung PJY, Huang B, Goreshnik I, Tam J, Carr KD, Singer B, Criswell C, Wicky BIM, Vafeados D, Sanchez MG, Kim HM, Torres SV, Chan S, Sun SM, Spear T, Sun Y, O'Reilly K, Maris JM, Sgourakis NG, Melnyk RA, Liu CC, Baker D. Bennett NR, et al. bioRxiv [Preprint]. 2025 Feb 28:2024.03.14.585103. doi: 10.1101/2024.03.14.585103. bioRxiv. 2025. PMID: 38562682 Free PMC article. Preprint.
  • Dynamic Assembly of Pentamer-Based Protein Nanotubes.
    Koziej L, Fatehi F, Aleksejczuk M, Byrne MJ, Heddle JG, Twarock R, Azuma Y. Koziej L, et al. ACS Nano. 2025 Mar 11;19(9):8786-8798. doi: 10.1021/acsnano.4c16192. Epub 2025 Feb 24. ACS Nano. 2025. PMID: 39993171 Free PMC article.
  • Flexing protein assemblies.
    Li Y, Zhang Y. Li Y, et al. Nat Struct Mol Biol. 2025 Jun;32(6):957-958. doi: 10.1038/s41594-025-01560-2. Nat Struct Mol Biol. 2025. PMID: 40355748 No abstract available.

References

    1. Howorka, S. Rationally engineering natural protein assemblies in nanobiotechnology. Curr. Opin. Biotechnol.22, 485–491 (2011). - PubMed
    1. Lee, E. J., Lee, N. K. & Kim, I.-S. Bioengineered protein-based nanocage for drug delivery. Adv. Drug Deliv. Rev.106, 157–171 (2016). - PubMed
    1. Olshefsky, A., Richardson, C., Pun, S. H. & King, N. P. Engineering self-assembling protein nanoparticles for therapeutic delivery. Bioconjug. Chem.33, 2018–2034 (2022). - PMC - PubMed
    1. Basu Mallik, B., Stanislaw, J., Alawathurage, T. M. & Khmelinskaia, A. De novo design of polyhedral protein assemblies: before and after the AI revolution. Chem. Bio. Chem.24, e202300117 (2023). - PubMed
    1. King, N. P. et al. Computational design of self-assembling protein nanomaterials with atomic level accuracy. Science336, 1171–1174 (2012). - PMC - PubMed

LinkOut - more resources