. 2025 Mar;639(8056):985-994.
doi: 10.1038/s41586-025-08589-9. Epub 2025 Feb 26.

Glycocalyx dysregulation impairs blood-brain barrier in ageing and disease

Affiliations

Glycocalyx dysregulation impairs blood-brain barrier in ageing and disease

Sophia M Shi et al. Nature. 2025 Mar.

Abstract

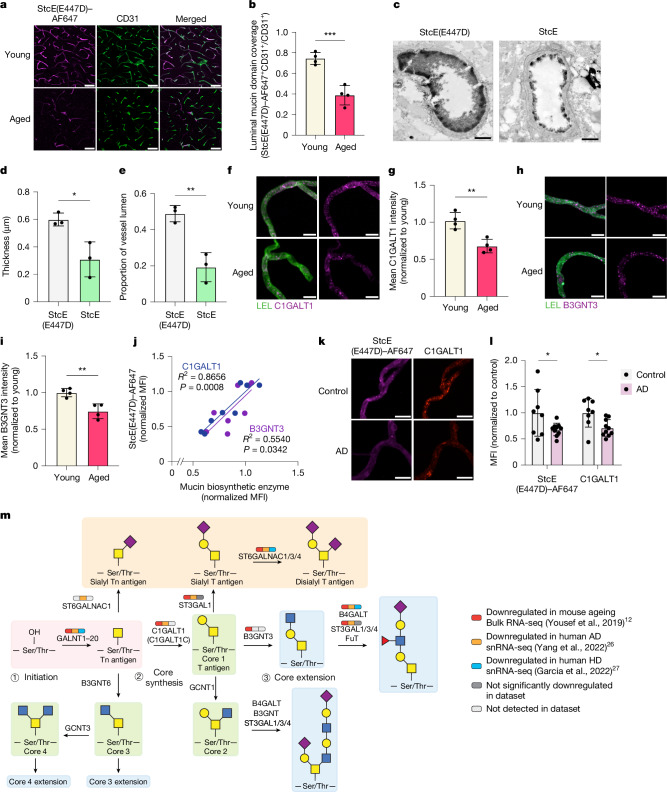
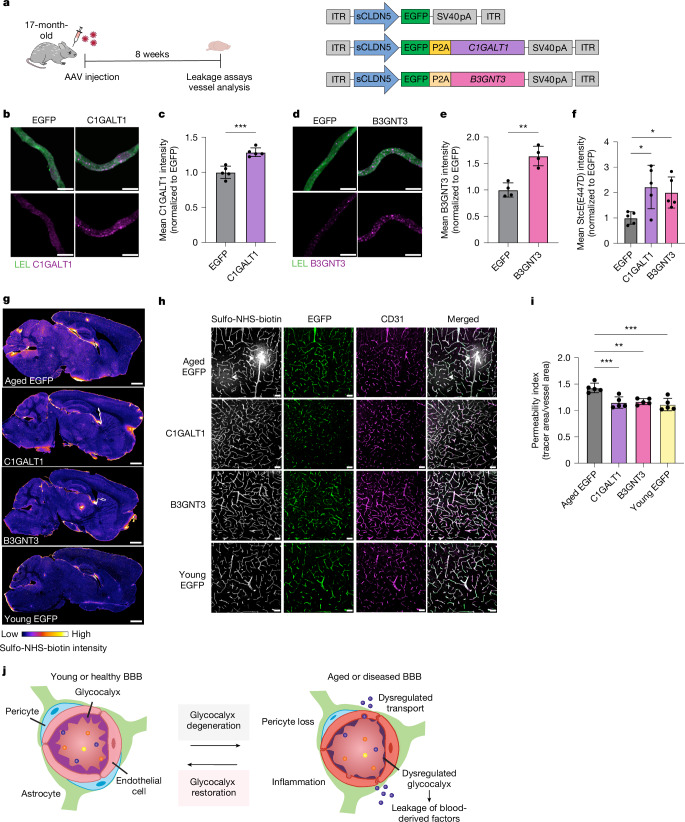
The blood-brain barrier (BBB) is highly specialized to protect the brain from harmful circulating factors in the blood and maintain brain homeostasis1,2. The brain endothelial glycocalyx layer, a carbohydrate-rich meshwork composed primarily of proteoglycans, glycoproteins and glycolipids that coats the BBB lumen, is a key structural component of the BBB3,4. This layer forms the first interface between the blood and brain vasculature, yet little is known about its composition and roles in supporting BBB function in homeostatic and diseased states. Here we find that the brain endothelial glycocalyx is highly dysregulated during ageing and neurodegenerative disease. We identify significant perturbation in an underexplored class of densely O-glycosylated proteins known as mucin-domain glycoproteins. We demonstrate that ageing- and disease-associated aberrations in brain endothelial mucin-domain glycoproteins lead to dysregulated BBB function and, in severe cases, brain haemorrhaging in mice. Finally, we demonstrate that we can improve BBB function and reduce neuroinflammation and cognitive deficits in aged mice by restoring core 1 mucin-type O-glycans to the brain endothelium using adeno-associated viruses. Cumulatively, our findings provide a detailed compositional and structural mapping of the ageing brain endothelial glycocalyx layer and reveal important consequences of ageing- and disease-associated glycocalyx dysregulation on BBB integrity and brain health.


Conflict of interest statement

Competing interests: T.W.-C. is a co-founder and scientific advisor of Alkahest Inc., a subsidiary of Grifols SA, Qinotto Inc., and Teal Omics Inc. C.R.B. is a co-founder and scientific advisory board member of Lycia Therapeutics, Palleon Pharmaceuticals, Enable Bioscience, Redwood Biosciences (a subsidiary of Catalent), OliLux Bio, Grace Science LLC, InterVenn Biosciences, Neuravid Therapeutics, GanNA Bio, Valora Therapeutics and Firefly Biologics. S.M.S., T.W.-C. and C.R.B. are co-inventors on a patent application related to the work published in this paper. The other authors declare no competing interests.

Figures

Fig. 1
Fig. 1. The brain endothelial glycocalyx is highly dysregulated during ageing.
a, Diagram of the BBB and brain endothelial glycocalyx layer. Approximations used for the relative sizing of glycocalyx components are described in the Supplementary Notes. b, TEM of cortical capillaries with lanthanum nitrate staining from young (3-month-old) and aged (21-month-old) mice. Scale bars, 1 µm. c, Quantification of luminal endothelial glycocalyx thickness of young (3-month-old) and aged (21-month-old) mice (n = 4 mice per group; two-sided t-test; mean ± s.e.m.). d, Quantification of luminal endothelial glycocalyx area of young (3-month-old) and aged (21-month-old) mice (n = 4 mice per group; two-sided t-test; mean ± s.e.m.). e, Volcano plot of differentially expressed glycosylation-related genes in brain endothelial cells from young (3-month-old) and aged (19-month-old) mice (genes upregulated with age in red and genes downregulated with age in blue). Original bulk RNA-seq data are from Yousef, et al.. f, Top glycosylation-related pathways that are upregulated and downregulated with age in brain endothelial cells. ER, endoplasmic reticulum; metab., metabolism. g, Experimental scheme for glycan and glycoconjugate profiling of brain endothelial cells via microvessel (MV) imaging and flow cytometry. PFA, paraformaldehyde. h, Mucin-domain glycoprotein expression and Lycopersicon esculentum (tomato) lectin (LEL; endothelial marker) labelling in acutely isolated microvessels. Scale bars, 10 µm. AF647, Alexa Fluor 647. i, Quantification of h (n = 4 mice per group; two-sided t-test; mean ± s.e.m.). jo, Median fluorescence intensity (MFI) of heparan sulfate (j; via 10E4 antibody), chondroitin sulfate (k; via CS-56 antibody), hyaluronan (l; via HABP), mucin-domain glycoproteins (m; via StcE(E447D)–AF647), α2,6-linked sialic acids (n; via SNA) and α2,3-linked sialic acids (o; via MAAII) on mechanically isolated brain endothelial cells from young (3-month-old) and aged (21-month-old) mice (n = 7 mice per group; two-sided t-test; mean ± s.e.m.). NS, not significant.
Fig. 2
Fig. 2. Mucin-type O-glycosylation is downregulated in brain endothelial cells during ageing and neurodegenerative disease.
a, Luminal mucin-domain glycoprotein expression based on StcE(E447D)–AF647 labelling in CD31+ cortical vasculature. Scale bars, 20 µm. b, Quantification of a (n = 4 mice per group; two-sided t-test; mean ± s.e.m.). c, TEM of cortical capillaries with lanthanum nitrate staining from mice treated with StcE(E447D) or StcE for 24 h. Scale bars, 1 µm. d, Quantification of luminal endothelial glycocalyx thickness of mice treated with StcE(E447D) or StcE (n = 3 mice per group; two-sided t-test; mean ± s.e.m.). e, Quantification of luminal endothelial glycocalyx areas of mice treated with StcE(E447D) or StcE (n = 3 mice per group; two-sided t-test; mean ± s.e.m.). f, C1GALT1 expression in acutely isolated microvessels labelled with LEL. Scale bars, 10 µm. g, Quantification of f (n = 4 mice per group, two-sided t-test; mean ± s.e.m.). h, B3GNT3 expression in acutely isolated microvessels labelled with LEL. Scale bars, 10 µm. i, Quantification of h (n = 4 mice per group, two-sided t-test; mean ± s.e.m.). j, Linear correlation between StcE(E447D) and C1GALT1 (blue) or B3GNT3 (purple) expression in acutely isolated microvessels. k, C1GALT1 and mucin-domain glycoprotein expression in acutely isolated microvessels from Alzheimer’s disease (AD) and age-matched control brains. Scale bars, 10 µm. l, Quantification of m (n = 8 control and 10 Alzheimer’s disease samples, two-sided t-test; mean ± s.e.m.). m, Mucin-type O-glycan biosynthetic pathway. Broad transcriptional downregulation of brain endothelial core 1 mucin-type O-glycan biosynthetic enzymes is observed in mouse ageing, Alzheimer’s disease and Huntington’s disease (HD) RNA-seq datasets,,.
Fig. 3
Fig. 3. Reduced brain endothelial mucin-type O-glycosylation increases BBB leakiness and brain bleeding.
a, Overview of AAV-mediated C1galt1 knockdown paradigm. ITR, inverted terminal repeat. b, C1GALT1 expression and mucin-domain glycoprotein labelling in acutely isolated microvessels. Scale bars, 10 µm. c, Quantification of C1GALT1 expression in b (n = 5 mice per group, two-sided t-test; mean ± s.e.m.). d, Quantification of mucin-domain glycoprotein labelling in b (n = 5, two-sided t-test; mean ± s.e.m.). e, Sulfo-NHS-biotin leakage in the cortices of young mice transduced with AAV-EGFP and AAV-miR-C1galt1. Scale bars, 500 µm. f, Sulfo-NHS-biotin leakage (indicated by white arrowheads) from EGFP+ cortical vessels of AAV-miR-C1galt1-transduced mice. Scale bars, 50 µm. g, Quantification of vessel permeability in f (n = 5 mice per group; two-sided t-test; mean ± s.e.m.). h, Overview of luminal mucin-domain glycoprotein degradation paradigm using 48 h StcE treatment. H&E, haematoxylin and eosin. i, Whole-brain images of sulfo-NHS-biotin leakage in mice treated with StcE for 48 h. Leakage is indicated by light-coloured hotspots and higher overall signal throughout the brain. Scale bars, 1 mm. j, Quantification of cortical vessel permeability in i (n = 4 mice per group; two-sided t-test; mean ± s.e.m.). k, Brains from mice treated with StcE for 48 h exhibit haemorrhaging. l, H&E images of cerebral bleeds in the meninges and ventricles of mice treated with StcE for 48 h. Scale bars, 50 µm. m, ROS signal in acutely isolated microvessels from mice treated with StcE for 48 h. Scale bars, 25 µm. n, Quantification of ROS signal in m (n = 6–7 mice per group, two-sided t-test; mean ± s.e.m.). o, TEM of brain endothelial tight junctions showing intact tight junctions (white asterisk) and abnormal tight junctions (detached, red asterisk; discontinuity, red arrow) in mice treated for 24 h with saline or StcE. Scale bar, 200 nm. p, Quantification of intact tight junctions in mice treated for 24 h with saline or StcE (n = 4 mice per group; two-sided t-test; mean ± s.e.m.). q, Label-free quantification (LFQ) of CLDN5 in microvessels via mass spectrometry (n = 4–5 mice per group; two-sided t-test; mean ± s.e.m.).
Fig. 4
Fig. 4. Restoration of mucin-type O-glycosylation improves BBB function in aged mice.
a, Overview of C1GALT1 and B3GNT3 overexpression paradigm and relevant AAV constructs. b, C1GALT1 expression in acutely isolated microvessels labelled with LEL. Scale bars, 10 µm. c, Quantification of b (n = 5 mice per group; two-sided t-test; mean ± s.e.m.). d, B3GNT3 expression in acutely isolated microvessels labelled with LEL. Scale bar = 10 µm. e, Quantification of d (n = 5 mice per group; one-way ANOVA with Dunnett’s post hoc test; mean ± s.e.m.). f, Quantification of mucin-domain glycoprotein labelling in acutely isolated microvessels (n = 5 mice per group; two-sided t-test; mean ± s.e.m.). g, Sulfo-NHS-biotin leakage in whole-brain sections of AAV-transduced mice. h, Sulfo-NHS-biotin leakage (indicated by arrowheads) from EGFP+ cortical vessels of AAV-transduced mice. Scale bars, 50 µm. i, Quantification of h (n = 5 mice per group; one-way ANOVA with Dunnett’s post hoc test; mean ± s.e.m.). j, Schematic of BBB dysfunction during ageing and neurodegenerative disease, highlighting new findings from this paper. The brain endothelial glycocalyx layer degenerates with ageing, thereby contributing to dysregulated BBB function. Restoring the glycocalyx may be an effective therapeutic approach for recovering BBB function in ageing-associated disease conditions.
Fig. 5
Fig. 5. Restoration of mucin-type O-glycosylation increases neuronal homeostasis, reduces glial inflammation and improves memory and learning in aged mice.
a, Experimental scheme used for behavioural testing of mice. b, Spatial working memory assessment using the Y maze (n = 26 (aged EGFP), 19 (C1GALT1), 23 (B3GNT3) and 20 (young EGFP); one-way ANOVA with Tukey’s post hoc test; mean ± s.e.m.). c, Hippocampal-dependent learning and memory assessment by contextual fear conditioning (n = 26 (EGFP), 18 (C1GALT1) and 19 (B3GNT3); one-way ANOVA with Dunnett’s post hoc test; mean ± s.e.m.). d, Outline of snRNA-seq profiling of pooled cortical and hippocampal tissue of young AAV-EGFP, aged AAV-EGFP and aged AAV-B3GNT3-treated groups. e, Uniform manifold approximation and projection (UMAP) of 69,250 nuclei from pooled cortical and hippocampal tissue of young AAV-EGFP, aged AAV-EGFP and aged AAV-B3GNT3-treated groups (n = 3 mice per group), coloured by cell type. BEC, brain endothelial cell; ExN, excitatory neuron; InN, inhibitory neuron; MG, microglia; OPC, oligodendrocyte precursor cell. f, Overview of key DEGs in each major cell type induced by AAV-B3GNT3 treatment in aged mice compared with AAV-EGFP. Astro, astrocyte. g, Volcano plot of ExN DEGs induced by AAV-B3GNT3 treatment in aged mice (upregulated genes in pink and downregulated genes in red). Padj, adjusted P value. h, Comparison of ExN DEG fold changes with B3GNT3 overexpression (y axis) and reverse ageing (x axis). Areas in which AAV-B3GNT3 treatment causes changes in the reverse direction of ageing are highlighted. i, Top upregulated pathways in ExN based on DEGs shared between AAV-B3GNT3 treatment and reverse ageing (top right quadrant in h). j, IBA1 and CD68 expression in the cortices of AAV-transduced mice. Scale bars, 50 µm. k, Quantification of CD68+ signal in IBA1+ microglia in j (n = 5 mice per group; one-way ANOVA with Tukey’s post hoc test; mean ± s.e.m.). l, Quantification of cortical IBA1+ area in j (n = 5 mice per group; one-way ANOVA with Tukey’s post hoc test; mean ± s.e.m.).
Extended Data Fig. 1
Extended Data Fig. 1. Heterogeneity in the brain endothelial glycocalyx layer.
a) Diagram of glycocalyx thickness and area measurements. b) Transmission electron micrographs of cortical capillaries with lanthanum nitrate staining from young (3-month-old) and aged (21-month-old) mice. Representative images of capillaries with glycocalyx measurements approximately in the high (80th–90th percentiles), medium (45th–55th percentiles), and low (10th–20th percentiles) ranges of all vessels captured for each group. Scale bar = 1 µm. c) Histograms of luminal endothelial glycocalyx thickness including 5-6 vessels from each animal in Fig. 1c. Fitted gaussian distributions are displayed for each group. d) Histograms of luminal endothelial glycocalyx areas including 5-6 vessels from each animal in Fig. 1d. Fitted gaussian distributions are displayed for each group. e) Histograms of luminal endothelial glycocalyx thickness including 5-6 vessels from each animal in Fig. 2d. Fitted gaussian distributions are displayed for each group. f) Histograms of luminal endothelial glycocalyx areas including 5-6 vessels from each animal in Fig. 2e. Fitted gaussian distributions are displayed for each group.
Extended Data Fig. 2
Extended Data Fig. 2. Compositional changes in the brain endothelial glycocalyx during aging.
a) Flow cytometry experimental scheme comparing mechanical (blue) and enzymatic (orange) brain dissociation methods demonstrating that mechanical dissociation better preserves several classes of glycans/glycoconjugates on brain endothelial cells. b) Hyaluronan, heparan sulfate, and α2,6-linked sialic acid expression in acutely isolated microvessels from young (3-month-old) and aged (21-month-old) mice. Scale bar = 10 µm. c-e) Quantification of (b) (n = 4, two-sided t-test; mean ± s.e.m.). f) α2,3-linked sialic acid, chondroitin sulfate, and terminal GalNAc expression in acutely isolated microvessels from young (3-month-old) and aged (21-month-old) mice. Scale bar = 10 µm. g-i) Quantification of (f) (n = 4, two-sided t-test; mean ± s.e.m.). j) Summary of aging-associated changes in brain endothelial glycan/glycoconjugate classes observed using bulk RNA-seq, fluorescence microvessel imaging, and flow cytometry profiling. k) Luminal sialic acid expression based on SNA-Cy3 labeling in CD31+ cortical vasculature. Scale bar = 20 µm. l) Quantification of (k) (n = 3 mice per group; two-sided t-test; mean ± s.e.m.).
Extended Data Fig. 3
Extended Data Fig. 3. Mucinase-derived tools for mucin degradation and vascular labeling.
a) Diagram of mucin degrading and labeling tools used in experiments. b) StcEE447D-AF647, PODXL (luminal marker), and COL4A (basement membrane marker) labeling in cortical vessels. Scale bar = 20 µm. c) Quantification of StcEE447D-AF647 colocalization with PODXL and COL4A via Pearson correlational analyses (n = 5 mice; two-sided paired t-test; mean ± s.e.m.). d) Quantification of StcEE447D-AF647 colocalization with PODXL and COL4A via Mander’s correlational analyses (n = 5 mice; two-sided paired t-test; mean ± s.e.m.). e) Marker intensity profiles across three vessels showing spatial correlation between StcEE447D-AF647, PODXL, and COL4A. Yellow labels indicate where intensity profiles were taken in representative image. Scale bar = 20 µm. f) Luminal mucin-domain glycoprotein expression in CD31+ vasculature in the hearts of young (3-month-old) and aged (21-month-old) mice. Scale bar = 20 µm. g) Quantification of (f) (n = 3 mice per group; two-sided t-test; mean ± s.e.m.). h) Luminal mucin-domain glycoprotein expression in CD31+ vasculature in the livers of young (3-month-old) and aged (21-month-old) mice. Scale bar = 20 µm. i) Quantification of (h) (n = 3 mice per group; two-sided t-test; mean ± s.e.m.).
Extended Data Fig. 4
Extended Data Fig. 4. Luminal cerebrovascular proteomics does not reveal substantial downregulation of mucin-domain glycoprotein scaffolds with age.
a) Luminal cerebrovascular proteomics scheme. b) Western blot of brain microvessel lysates from mice perfused with PBS or sulfo-NHS-biotin detected via streptavidin. In, input; FT, flowthrough; E, eluate. c) Cerebrovascular labeling by sulfo-NHS-biotin detected via streptavidin. Scale bar = 25 µm. d) Gene ontology (GO) term cellular component and biological process analysis of all proteins detected in luminal cerebrovascular proteomics experiment. e) Principal component analysis (PCA) of proteomic samples from young (3-month-old) versus aged (21-month-old) mice (n = 6 mice per group). f) Volcano plot of luminal cerebrovascular proteins identified in young (3-month-old) versus aged (21-month-old) mice (n = 6 mice per group). Peptide and protein identifications were filtered to a 1% FDR. Notable mucin-domain glycoproteins are highlighted in purple. Proteins only detected in young animals (in ≥ 50% of young animals) are highlighted in blue in the upper lefthand corner. Proteins only detected in aged animals (in ≥ 50% of aged animals) are highlighted in red in the upper righthand corner. g) NID1 expression in cortical vessels in young (3-month-old) versus aged (21-month-old) mice. Areas with poorly colocalized NID1 and StcEE447D-AF647 signal are indicated by the white triangles. Scale bar = 50 µm. h) Quantification of NID1 expression in COL4A+ vasculature in (g) (n = 3 mice per group; two-sided t-test; mean ± s.e.m.). i) Quantification of vascular NID1 colocalization with StcEE447D and COL4A via Pearson correlation (n = 8 images from aged mouse group; two-sided paired t-test; mean ± s.e.m.).
Extended Data Fig. 5
Extended Data Fig. 5. Transcriptional dysregulation in brain endothelial glycosylation pathways in neurodegenerative diseases.
a) Volcano plot of differentially expressed glyco-genes in brain endothelial cells from patients with Alzheimer’s disease (AD) and age-matched control individuals (genes upregulated with AD in red and genes downregulated with AD in blue). Original snRNA-seq data from Yang, et al.. b) Top upregulated and downregulated glycosylation-related pathways in brain endothelial cells in patients with AD versus age-matched control individuals. c) Volcano plot of differentially expressed glyco-genes in brain endothelial cells from patients with Huntington’s disease (HD) and age-matched control individuals (genes upregulated with HD in red and genes downregulated with HD in blue). Original snRNA-seq data from Garcia, et al.. d) Top upregulated and downregulated glycosylation-related pathways in brain endothelial cells in patients with HD versus age-matched control individuals. e) Venn diagram of significantly upregulated brain endothelial glyco-genes that are shared amongst mouse aging, AD, and HD datasets. f) Venn diagram of significantly downregulated brain endothelial glyco-genes that are shared amongst mouse aging, AD, and HD datasets. Mucin-type O-glycan biosynthetic enzymes are highlighted in purple.
Extended Data Fig. 6
Extended Data Fig. 6. Additional characterization of brain endothelial mucin-type O-glycan biosynthetic enzyme knockdown and overexpression and BBB leakage.
a) Reduction of StcEE447D-AF647 binding following knockdown of C1galt1 in bEnd.3 cells using AAV-miR-E constructs compared to AAV-EGFP via flow cytometry (n = 4 per group; one-way ANOVA with the Šidák post hoc test; mean ± s.e.m.). b) Sulfo-NHS-biotin leakage in whole brain sections of AAV-transduced mice. Scale bar=1 mm. c) Sulfo-NHS-biotin, albumin, and IgG leakage (indicated by white triangles) from cortical vessels of AAV-transduced mice. Scale bar = 100 µm. d) Quantification of albumin signal area over background threshold in (c) (n = 4 mice per group; two-sided t-test; mean ± s.e.m.). e) Quantification of IgG signal area over background threshold in (c) (n = 4 mice per group; two-sided t-test; mean ± s.e.m.). f) Cortical IgG signal in (c) (n = 4 mice per group; two-sided t-test; mean ± s.e.m.). g) Cortical albumin signal in (c) (n = 4 mice per group; two-sided t-test; mean ± s.e.m.). h) Cortical sulfo-NHS-biotin signal in (c) (n = 4 mice per group; two-sided t-test; mean ± s.e.m.). i) Increased StcEE447D-AF647 binding following overexpression of C1GALT and B3GNT3 in bEnd.3 cells using AAV-C1GALT1 and AAV-B3GNT3 compared to AAV-EGFP via flow cytometry (n = 4 per group; one-way ANOVA with Dunnett’s post hoc test; mean ± s.e.m.). j) Whole brain images of sulfo-NHS-biotin leakage in young (3-month-old) and aged (23-month-old) wild-type C57BL/6 mice (n = 2 mice per group). Scale bar = 1 mm. k) High-resolution images of cortical sulfo-NHS-biotin leakage hotspots in aged AAV-EGFP-treated mouse brain image from Fig. 4g showing major and moderate hotspots of leakage. Scale bar = 250 µm (major leakage), 500 µm (moderate leakage), and 100 µm (three close-up images of moderate leakage).
Extended Data Fig. 7
Extended Data Fig. 7. Additional characterization of StcE treatment in young mice.
a) Overview of luminal mucin-domain glycoprotein degradation paradigm using 24-h StcE treatment. b) Whole brain images of sulfo-NHS-biotin leakage in StcE-treated mice at 24 h. Scale bar = 1 mm. c) Quantification of cortical vessel permeability to sulfo-NHS-biotin in (b) (n = 4 mice per group; two-sided t-test; mean ± s.e.m.). d) Mucin domain, heparan sulfate, chondroitin sulfate, and hyaluronan expression in acutely isolated microvessels from 24-h saline- and StcE-treated mice. Scale bar = 10 µm. e) Quantification of (d) (n = 3 mice per group, two-sided t-test; mean± s.e.m.). f) Sulfo-NHS-biotin leakage (white) from blood vessels in different brain regions of 48-h StcE-treated mice. Scale bar = 50 µm. g) Quantification of sulfo-NHS-biotin permeability in different brain regions in saline- and 48-h StcE-treated mice (n = 4 mice per group; two-sided t-test; mean ± s.e.m.). h) Additional brains from 48-h StcE-treated mice exhibiting hemorrhaging (n = 4 mice per group). i) H&E images of lung, liver, and kidney in saline and 48-h StcE-treated mice. Scale bar = 50 µm. j) Luminex quantification of major inflammatory cytokines in plasma from young mice following saline, StcEE447D, and StcE treatment. (n = 4 mice per group, one-way ANOVA with Dunnett’s post hoc test; mean ± s.e.m.).
Extended Data Fig. 8
Extended Data Fig. 8. Mucin degradation downregulates vascular homeostatic genes and increases ROS generation in bEnd.3 cells.
a) Overview of assays to characterize the effects of 16-h StcE treatment on bEnd.3 cells. b) PCA of bulk RNA-seq data of saline- and StcE-treated bEnd.3 cells (n = 5 wells per group). c) Volcano plot of gene expression changes induced by StcE treatment (genes upregulated by StcE treatment are in orange and genes downregulated by StcE treatment are in teal). d) Top upregulated and downregulated GO biological processes in bEnd.3 cells treated with StcE vs. saline. e) Normalized counts of genes involved in TGF-β signaling (n = 5 wells per group; two-sided t-test; mean ± s.e.m.). f) Normalized counts of genes involved in oxidative stress regulation (n = 5 wells per group; two-sided t-test; mean ± s.e.m.). g) Normalized counts of genes involved in vascular development and survival (n = 5 wells per group; two-sided t-test; mean ± s.e.m.). h) Immunofluorescence images of ROS signal in bEnd.3 cells as assayed by DCF fluorescence. Scale bar = 50 µm. i) Quantification of (h) (n = 3-4 wells per group; two-sided t-test; mean ± s.e.m.). j) Immunofluorescence images of ROS signal in bEnd.3 cells as assayed by the Cellular ROS Deep Red kit. Scale bar = 50 µm. k) Quantification of (j) (n = 3-4 wells per group; two-sided t-test; mean ± s.e.m.). l) Flow cytometry quantification of adhesion molecules in bEnd.3 cells treated with saline or StcE (n = 4 wells per group; two-sided t-test; mean ± s.e.m.).
Extended Data Fig. 9
Extended Data Fig. 9. Cerebrovascular proteomics of StcE-treated mice.
a) Volcano plot of cerebrovascular protein changes induced by 24-h StcE treatment (genes upregulated by StcE treatment are in orange and genes downregulated by StcE treatment are in teal). b) Volcano plot of cerebrovascular protein changes induced by 48-h StcE treatment (genes upregulated by StcE treatment are in orange and genes downregulated by StcE treatment are in teal). c) Top downregulated KEGG pathways with StcE treatment. d) Top upregulated KEGG pathways with StcE treatment.
Extended Data Fig. 10
Extended Data Fig. 10. Additional snRNA-seq analysis.
a) UMAP of 69,250 nuclei from pooled cortical and hippocampal tissues of young AAV-EGFP, aged AAV-EGFP, and aged AAV-B3GNT3 groups (n = 3 mice per group), colored by experimental group. b) UMAP of 69,250 nuclei from the cortex and hippocampus of young AAV-EGFP, aged AAV-EGFP, and aged AAV-B3GNT3 groups (n = 3 mice per group), colored by cluster. c) Summary quantification of the proportion of captured cell types by treatment group. d) Summary of the number of DEGs across comparisons of aged AAV-EGFP, aged AAV-B3GNT3, and young AAV-EGFP for each major cell type. e) Venn diagram of the number and examples of excitatory neuronal DEGs upregulated with AAV-B3GNT3 treatment in aged mice and with reverse aging. f) Network analysis of shared excitatory neuronal pathways upregulated with aged AAV-B3GNT3 and in reverse aging. g) Volcano plot of DEGs in oligodendrocytes induced by AAV-B3GNT3 treatment in aged mice (genes upregulated with AAV-B3GNT3 treatment in orange and genes downregulated with AAV-B3GNT3 treatment in yellow). h) Comparison of log2-transformed fold changes of DEGs with B3GNT3 overexpression (Aged B3GNT3/Aged EGFP) and reverse aging (Young EGFP/Aged EGFP). Areas in which AAV-B3GNT3 treatment causes changes in the opposite direction of aging are highlighted. i) Top downregulated pathways in oligodendrocytes based on DEGs shared between AAV-B3GNT3 treatment and reverse aging (bottom left quadrant in (h)).

References

    1. Chow, B. W. & Gu, C. The molecular constituents of the blood–brain barrier. Trends Neurosci.38, 598–608 (2015). - PMC - PubMed
    1. Banks, W. A., Reed, M. J., Logsdon, A. F., Rhea, E. M. & Erickson, M. A. Healthy aging and the blood–brain barrier. Nat. Aging1, 243–254 (2021). - PMC - PubMed
    1. Kutuzov, N., Flyvbjerg, H. & Lauritzen, M. Contributions of the glycocalyx, endothelium, and extravascular compartment to the blood–brain barrier. Proc. Natl Acad. Sci. USA115, E9429–E9438 (2018). - PMC - PubMed
    1. Ando, Y. et al. Brain-specific ultrastructure of capillary endothelial glycocalyx and its possible contribution for blood brain barrier. Sci Rep.8, 17523 (2018). - PMC - PubMed
    1. Reitsma, S., Slaaf, D. W., Vink, H., Van Zandvoort, M. A. M. J. & Oude Egbrink, M. G. A. The endothelial glycocalyx: composition, functions, and visualization. Pflugers Arch. Eur. J. Physiol.454, 345–359 (2007). - PMC - PubMed

MeSH terms

LinkOut - more resources