. 2025 Apr;640(8059):714-721.
doi: 10.1038/s41586-025-08596-w. Epub 2025 Feb 26.

Integrated analysis of the complete sequence of a macaque genome

Affiliations

Integrated analysis of the complete sequence of a macaque genome

Shilong Zhang et al. Nature. 2025 Apr.

Abstract

The crab-eating macaques (Macaca fascicularis) and rhesus macaques (Macaca mulatta) are pivotal in biomedical and evolutionary research1-3. However, their genomic complexity and interspecies genetic differences remain unclear4. Here, we present a complete genome assembly of a crab-eating macaque, revealing 46% fewer segmental duplications and 3.83 times longer centromeres than those of humans5,6. We also characterize 93 large-scale genomic differences between macaques and humans at a single-base-pair resolution, highlighting their impact on gene regulation in primate evolution. Using ten long-read macaque genomes, hundreds of short-read macaque genomes and full-length transcriptome data, we identified roughly 2 Mbp of fixed-genetic variants, roughly 240 Mbp of complex loci, 16.76 Mbp genetic differentiation regions and 110 alternative splice events, potentially associated with various phenotypic differences between the two macaque species. In summary, the integrated genetic analysis enhances understanding of lineage-specific phenotypes, adaptation and primate evolution, thereby improving their biomedical applications in human disease research.


Conflict of interest statement

Competing interests: E.E.E. is a scientific advisory board member of Variant Bio. The other authors declare no competing interests.

Figures

Extended Data Figure 1.
Extended Data Figure 1.. The conceptual workflow of this study.
This diagram illustrates the research strategy in this study.
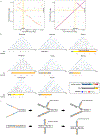
Extended Data Figure 2.
Extended Data Figure 2.. Previously unresolved regions.
(a) A synteny plot (top) displays the alignment of the newly assembled chr. Y (T2T-MFA8v1.1) against the previous macaque assembly (Mmul_10). Blue and yellow blocks represent forward and reversed alignments, respectively. The tracks (bottom) show the newly assembled sequences (compared to Mmul_10), sequence classes, gene density, non-B DNA density, palindromes, and intrachromosomal sequence identity, respectively. (b) The bar plot illustrates the repeat annotation of newly added sequences. (c) The syntenic comparison highlights the rDNA and centromere regions on chr. 10 between T2T-MFA8v1.1 and Mmul_10. The upper panel illustrates the syntenic relationship between these assemblies, alongside their repeat annotations and mappability. In the lower panel, the HiFi and ONT coverage for T2T-MFA8v1.1 is depicted, with black and red dots marking the primary and secondary alleles, respectively. (d) Syntenic comparison of rDNA units between T2T-MFA8v1.1 (chr. 10) and T2T-CHM13v2.0 (chr. 22). The dot plot demonstrates a conserved synteny in the rDNA coding regions between humans and macaques. The common repeat annotation and methylation patterns are listed along the axes. (e) The complete centromere assemblies of T2T-MFA8v1.1. Colors represent the suprachromosomal families (SF) of α-satellites, with the lengths of the α-satellite arrays indicated. The centromere dip regions are marked with triangles, as obtained by methylation calling.
Extended Data Figure 3.
Extended Data Figure 3.. The comprehensive gene annotation set of T2T-MFA8v1.1 and PNPO analysis.
(a) The ideogram track shows the centromeric satellites (yellow) and segmental duplications (red), with newly added protein-coding genes labeled above. Genes that are not available in NCBI are marked with “CXorfXXX”. (b) The red dashed line represents a 21 kbp unassembled region in Mmul_10. Gene models are shown on the top with read-depth validation below. CLR: continuous long reads. (c) The short-read RNA-seq confirms the exon-skipping event in MFA (two-sided Mann-Whitney U test). The y-axis refers to the split-read rate of exon-5 on PNPO. Box plots denote median and interquartile range (IQR), with whiskers 1.5×IQR. The number of biological replicates is indicated in parentheses below each plot. (d) The qPCR validation supports that the genotypes (C/C, C/A, and A/A) are potentially associated with exon-5 skipping in MFA. The genotype frequencies are listed in the parentheses below each plot. Each dot represents different biological replicates (error bars, mean ± s.d.). (e) The predicted protein structures of PNPO with and without exon-5 suggest the potential loss of enzyme activity due to disrupted interactions. The zoomed-in panel highlights key amino acids (K72, Y129, R133, S137, W178, R197, and H199) within the active site, with those specific to exon-5 (Y129, R133, and S137) shown in gray.
Extended Data Figure 4.
Extended Data Figure 4.. The quality control, variant discovery, and structural haplotype analysis of the macaque pangenome.
(a) Flagger evaluation of 20 haplotype-resolved assemblies is shown on the left panel, while the right panel shows the average across 20 assemblies and the evaluation of T2T-MFA8 (no chr. Y). (b) The cumulative number of added bases when adding assemblies one by one is illustrated, with red representing MFA and blue representing MMU. The total of added polymorphic sequences shows slow growth after the seventh MFA or MMU assembly. The species switch (MFA→MMU) increases the yield of added sequences. Transparent colors indicate singleton (AF < 5%), doubleton (5% ≤ AF < 10%), polymorphic (10% ≤ AF < 50%), and common (AF ≥ 50%) alleles. (c) The left panel shows the number of small variants (top) and SVs (bottom) per haplotype in the pangenome graph. The right panel shows the average number of small variants (top) and SVs (bottom) of MFA, MMU, and humans (from the HPRC-year1 MC pangenome graph). (d) The biallelic SNV comparison between the pangenome graph and the macaque whole-genome sequencing (WGS) cohort (289 macaques). The gray histogram illustrates the count of SNVs from the macaque cohort at MAF cutoffs (x-axis, e.g., MAF > 0.05 includes the SNV count with MAF greater than 0.05), while the line chart represents the fraction of these SNVs covered by the pangenome. This panel shows that the pangenome graph covers 80% of genetic variation with MAF ≥ 5% in the macaque cohort. (e, f) These panels show the correlation of AFs between the pangenome and 79 wild samples (e) and between the macaque cohort and the same wild samples (f). (g) The bar plot illustrates the most common copy number (CN) variable genes in SDR hotspots of macaques. The x-axis represents the number of gene copies that can be mapped to a bubble in the pangenome graph, while the y-axis shows the 17 most CN variable genes. (h) This panel demonstrates the complexity of major histocompatibility complex (MHC) in macaques. SNV and SV densities for eight structural haplotypes with gene models are shown above (top). The syntenic relationship between T2T-MFA8v1.1 and MFA186ZAI-H2 (bottom) shows a ~1 Mbp deletion in MFA186ZAI-H2 with respect to T2T-MFA8v1.1. (i) This panel displays the syntenic relationship of the CYP2C76 region in primates. In each assembly, the syntenic regions are represented as blocks, while non-syntenic regions are represented as thin lines, along with their DupMasker and gene annotation attached to each genome segment. (j) The structural representation of the GSTM family is shown, with the gene annotation. Green and purple refer to the start and end of GSTM gene bodies, respectively. (k) The graphical representation of four structural haplotypes of GSTM follows different paths in the pangenome, with red and purple representing the start and end of a path, respectively. The haplotype of T2T-MFA8v1.1 is GSTM (5A, 1A, 1B, 2). (l) The table illustrates the frequency statistics of GSTM haplotypes and their schematic graph. The frequency of structural haplotypes in the pangenome graph is displayed in the first column, while the inferred frequency from the population with short-read genotyping is shown in the second column.
Extended Data Figure 5.
Extended Data Figure 5.. The fixed variants, genetic differentiation regions, and inversions between MFA and MMU.
(a) Principal component analysis (PCA) of three macaque populations. The first component (18.6%, x-axis) separates MFA (red) and MMU, while the second component (11%, y-axis) distinguishes CMMU (Chinese rhesus macaque) and IMMU (Indian rhesus macaque). The macaque individuals are clustered according to each population. Newly sequenced samples in this study are marked in color, while the samples from the previous study are marked in gray. (b) Lineage-specific fixed genetic variation. The length distribution of fixed INDELs and SVs are shown in the left panel (INDEL: 2–20 bp (top), SV: 50–500 bp (bottom)) and right (INDEL: 20–50 bp (top), SV: 500–10000 bp (bottom)). Notable peaks for Alu and L1 are at 300 bp and 6000 bp. A fixed SNV in PLA2G3 (c) and a fixed SV in EHBP1L1 (d) result in amino acid differences between MFA and MMU. (e) A genetic differentiation region associated with SRCAP and PHKG2. The gene models, π diversity, FST, and XP-EHH across the genomic region are shown from top to bottom. The dotted lines indicate the bottom 5% threshold from π diversity, the top 5% from FST, and the top 5% from XP-EHH, respectively. (f, g) Fixed missense variants of SRCAP (f) and PHKG2 (g) result in amino acid differences between MFA and MMU. (h) The syntenic relationship of the inversion with the longest length (4 Mbp) within macaques, with the gene annotation above. (i) The heatmap shows the DEGs within the 500 kbp flanking regions of macaque inversion (≥ 10 kbp) breakpoints (Z-score of rlog-transformed counts). Each row represents a gene and each column represents a tissue.
Extended Data Figure 6.
Extended Data Figure 6.. The comparative analysis on macaque centromeres.
(a) The dot plot shows the chr. 1 α-satellite arrays between MFA and MMU, generated with UniAligner. The red dots refer to the common rare k-mers (k ≥ 80) and the green dots refer to the conserved regions between two centromeres. The black line indicates the optimal rare alignment path. The α-satellite array strand track is shown above the dot plot (blue for forward strand (+) and red for reverse strand (–)). (b) The SF and methylation patterns of α-satellite arrays on chr. 1 for both MFA and MMU are depicted. Sequence similarity within the 5 kb block is visualized using ModDotPlot, with the CDRs highlighted in red by corresponding methylation levels. (c) The green, red, and blue violin plots represent the length distribution of α-satellite arrays for HSA, MFA, and MMU, respectively. The horizontal lines indicate the length of reference genomes (green for T2T-CHM13v2.0 and red for T2T-MFA8v1.1). Box plots show median and IQR, with whiskers 1.5×IQR. The P values are calculated with the two-sided Mann-Whitney U test, and the number of assembled centromeres is indicated in parentheses below each plot. NS: not significant. (d) The phylogenetic tree shows that the S1 (red), S2a (blue), S2b (green), and SF9 α-satellites (dark gray) of MFA (round) and MMU (triangle) mixed in their respective separate clades. (e) The phylogeny trees for monomers of S1S2 dimers from MFA chr. 8 (yellow), chr. 11 (red) and chr. 17 (lilac). S2a has chromosome-specific variants while S1 and S2b do not.
Extended Data Figure 7.
Extended Data Figure 7.. The multi-omics profiles between human FOLH1 and macaque FOLH1.
The top panel illustrates the multi-omics profiles at human FOLH1 locus (T2T-CHM13v2.0 chr. 11, reversed strand), while the bottom panel shows the corresponding profiles in macaque FOLH1 locus (T2T-MFA8v1.1 chr. 14, forward strand). For the syntenic plot in the middle, blue and yellow blocks represent forward and reversed alignments, respectively. The potential contacts are depicted as loops alongside the Hi-C contact maps, with arrows marking these interactions within the maps. The scATAC-seq tracks are normalized with transcription start site enrichment score, the ChIP-seq tracks are normalized with bins per million mapped reads, and the contact maps are normalized with ICE (iterative correction and eigenvector decomposition).
Extended Data Figure 8.
Extended Data Figure 8.. The genetic mechanisms of the palindrome-mediated translocation.
(a) The dot plots illustrate the syntenic relationship between the ancestral and duplicated copies (left panel), as well as the self-syntenic relationship of the ancestral copy (right panel). The positions of human FOLH1 and FOLH1B are highlighted with a yellow background. (b) The panel displays sequence identity heatmaps for NHPs, with the 1 Mbp flanking region of the FOLH1 q-arm, including segmental duplications (SDs) and satellite sequences shown below. Vertical lines in the identity heatmaps indicate palindromic sequences. (c) The schematic diagram describes the potential, reported DNA double-strand break repair mechanism underlying palindrome-mediated translocation. Palindromic sequences and their directions are indicated with arrows.
Extended Data Figure 9.
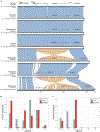
Extended Data Figure 9.. The evolutionary history of APCDD1 and PIEZO2 and their expression patterns.
(a) The syntenic relationship of APCDD1 and PIEZO2 in primates is shown with minimiro, with gene annotations and DupMasker attached to each genome segment. PIEZO2 is located inside an inversion in the primate evolution, while APCDD1 is located near the inversion. (b, c) The bar plot shows the proportion of cell types for expressed cells on APCDD1 (b) and PIEZO2 (c). The proportion differences in expressed cell type are observed in APCDD1 and PIEZO2 between humans and macaques. OPC: oligodendrocyte precursor cell, Oligo: oligodendrocyte, Micro: microglia, In Neuron: inhibitory neuron, Ex Neuron: excitatory neuron, Astro: astrocyte.
Figure 1.
Figure 1.. Overview of the complete T2T-MFA8 macaque genome.
(a) Schematic representation of the generation of parthenogenetic embryonic stem cells (ESCs) used for genome assembly. ICMs: inner cell masses. (b) Ideogram highlighting key features of T2T-MFA8v1.1 assembly. SD, segmental duplication; CenSat, centromeric and pericentromeric satellite. (c) Pie chart showing the total length and repeat annotation of added sequences. (d) Fluorescence in situ hybridization (FISH) validation confirming rDNA localization exclusively on macaque chr10. Each experiment was repeated 3 times and 10 metaphase spreads with relative fluorochromes were captured for each experiment. Scale bar, 2 μm. HSA: Homo sapiens, MMU: Macaca mulatta, MFA: Macaca fascicularis, MSY: Macaca sylvana.
Figure 2.
Figure 2.. Fusion genes and alternative splice sites.
(a) Schematic illustration of three types gene fusion: readthrough (n=40), only stop codon skipping (n=30), and both start & stop codon skipping (n=42). (b) Gene fusion in a high gene density region. The number of genes adjacent to a fusion gene (red line) is significantly higher than the genome wide average (grey distribution) (one-sided permutation test, empirical P = 0). (c) A fixed genetic variant between MMU and MFA (CG→AG) influences the splicing pattern of PNPO. The bottom two tracks indicate Iso-seq read depth. (d) Western blot showing reduced protein production of PNPOd5. Each lane is an independent transfection replicate (n=3). UT, untreated. (e) The mean protein-to-mRNA ratio for PNPOd5 is approximately 17% of that of PNPO (one-way ANOVA with Tukey’s multiple comparisons test, P = 0.028; error bars, mean ± s.d.). Each dot represents independent transfection replicates (n=3).
Figure 3.
Figure 3.. A pangenome graph with 20 haplotype-resolved macaque assemblies and genomic differential regions between MFA and MMU.
(a) Cumulative genome length distribution of 10 haplotype-resolved MFA assemblies (red) and 10 MMU assemblies (blue) (average NG50=88 Mbp), compared with T2T-MFA8v1.1, T2T-CHM13v2.0, Mmul_10 (split by Ns) and 94 human genome assemblies from HPRC-year1 (light gray). (b) Copy number (CN) differentiation between MFA and MMU. Mafa-AG and Mafa-B data points are off the axis. SDI, Shannon diversity index. (c) Structural haplotypes of CYP2C76 copies, with green and purple marking the start and end of the gene body, respectively. Frequency statistics for each haplotype are shown below. (d) Graphical representation of four structural haplotypes of CYP2C76, with red and purple representing the start and end of a path, respectively. (e) Genetic differentiation analysis between MFA and MMU. Manhattan plots show XP-EHH scores for MFA vs. CMMU (top) and MFA vs. IMMU (bottom) with horizontal dotted lines indicating the top 5% threshold. Differential regions identified as the top 5% XP-EHH, bottom 5% π diversity, and top 5% FST are marked in purple or green. Genes with fixed amino acid changes are marked as deep red. (f) A genetic differentiation region associated with the HOXD gene family.
Figure 4.
Figure 4.. Genomic differences between humans and macaques.
(a) Chromosomal rearrangements between T2T-MFA8v1.1 (MFA) and T2T-CHM13v2.0 (HSA). Macaque and human chromosomes are listed on the left and right, respectively (inversions in green, nested inversions in dark green, and intrachromosomal translocations in blue). Newly identified rearrangements (n=21) are marked with triangles, with numbers indicating the count of novel events at each location (n ≥ 2). An asterisk (*) denotes the inverted orientation of a chromosome strand (q-arm to p-arm). (b) FISH validation of three newly reported large-scale rearrangements between humans and macaques. Each experiment was repeated 3 times and 10 metaphase spreads with relative fluorochromes were captured for each experiment. (c) Percentage and expression of genes expressed in different cellular types of the prefrontal cortex in humans and macaques. The genes within SDs are marked by an asterisk. The macaque FOLH1 and human FOLH1B are positional orthologous, indicated as FOLH1. OPC: oligodendrocyte precursor cell, Oligo: oligodendrocyte, Micro: microglia, In Neuron: inhibitory neuron, Ex Neuron: excitatory neuron, Astro: astrocyte.
Figure 5.
Figure 5.. Evolutionary divergence in human FOLH1 and FOLH1B.
(a) Syntenic comparison of T2T-MFA8v1.1 chr14 (human chr11), illustrating the origin of the FOLH1 gene family. (b) Phylogenetic tree showing the duplication of FOLH1 and FOLH1B in the ancestor of African great apes (~10.55 million years ago). (c-g) t-SNE visualization of cell types expressing FOLH1 and FOLH1B in humans and macaques. (h) Expression proportions of FOLH1 and FOLH1B across cell types, with the total number of expressing cells shown in brackets. (i) Syntenic comparison and epigenetic profiles of human FOLH1 and FOLH1B, showing a 1,393 bp deletion in FOLH1B. A detailed view shows the depletion of FOLH1 exon-1 and three candidate cis-regulatory elements (cCREs) in human FOLH1B. CTCF, CCCTC-binding factor.

Update of

References

    1. Warren WC et al. Sequence diversity analyses of an improved rhesus macaque genome enhance its biomedical utility. Science (2020). 10.1126/science.abc6617 - DOI - PMC - PubMed
    1. Gibbs RA et al. Evolutionary and Biomedical Insights from the Rhesus Macaque Genome. Science (2007). 10.1126/science.1139247 - DOI - PubMed
    1. Rogers J, Gibbs RA, Rogers J & Gibbs RA Comparative primate genomics: emerging patterns of genome content and dynamics. Nature Reviews Genetics 15 (2014). 10.1038/nrg3707 - DOI - PMC - PubMed
    1. Haus T et al. Genome typing of nonhuman primate models: implications for biomedical research. Trends in Genetics 30 (2014). 10.1016/j.tig.2014.05.004 - DOI - PubMed
    1. Nurk S et al. The complete sequence of a human genome. Science (2022). 10.1126/science.abj6987 - DOI - PMC - PubMed

LinkOut - more resources