. 2025 Apr;640(8059):828-839.
doi: 10.1038/s41586-025-08656-1. Epub 2025 Feb 26.

Genome-coverage single-cell histone modifications for embryo lineage tracing

Affiliations

Genome-coverage single-cell histone modifications for embryo lineage tracing

Min Liu et al. Nature. 2025 Apr.

Abstract

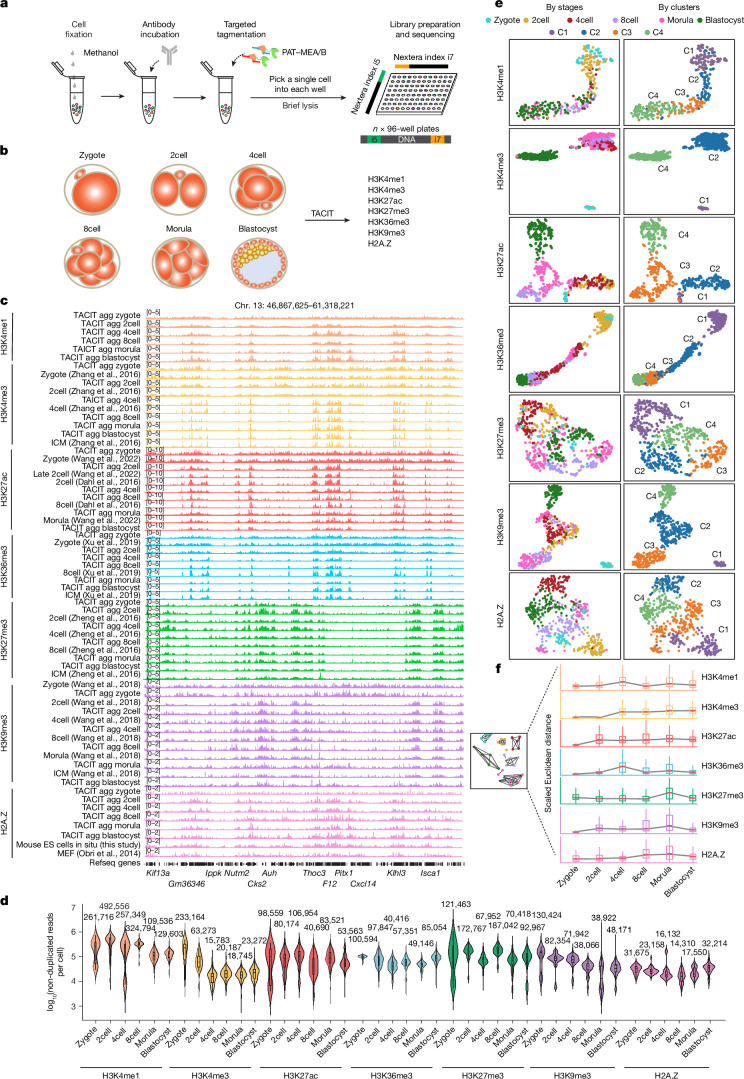
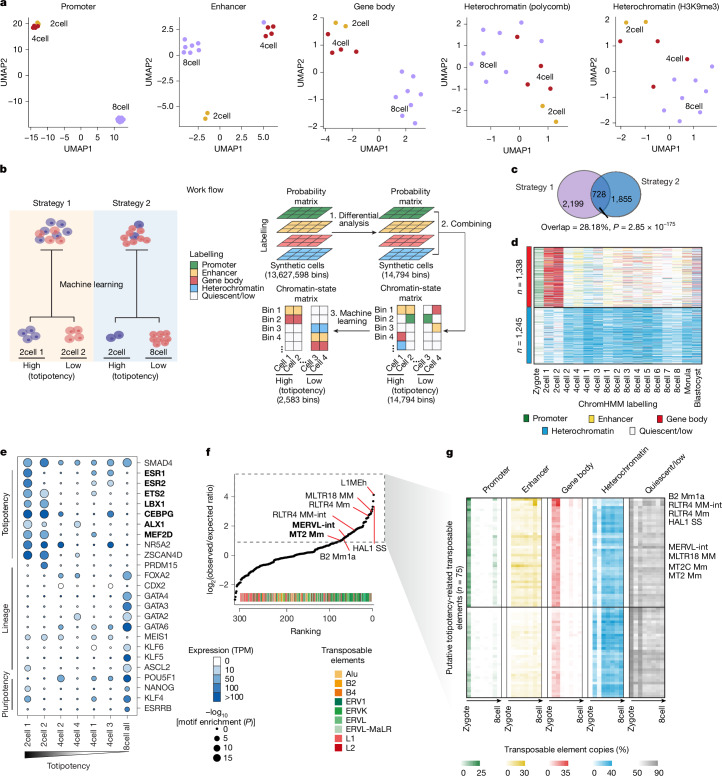
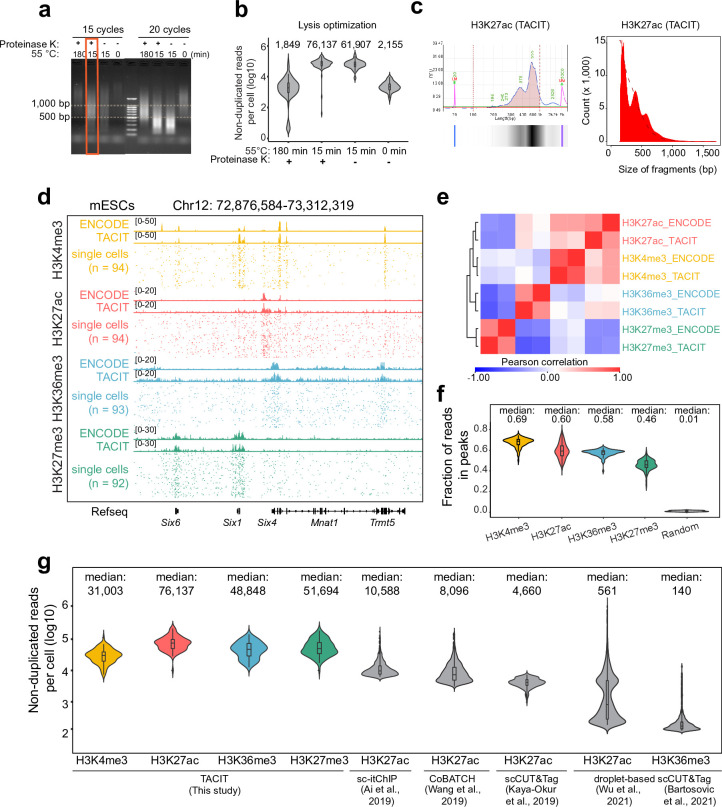
Substantial epigenetic resetting during early embryo development from fertilization to blastocyst formation ensures zygotic genome activation and leads to progressive cellular heterogeneities1-3. Mapping single-cell epigenomic profiles of core histone modifications that cover each individual cell is a fundamental goal in developmental biology. Here we develop target chromatin indexing and tagmentation (TACIT), a method that enabled genome-coverage single-cell profiling of seven histone modifications across mouse early embryos. We integrated these single-cell histone modifications with single-cell RNA sequencing data to chart a single-cell resolution epigenetic landscape. Multimodal chromatin-state annotations showed that the onset of zygotic genome activation at the early two-cell stage already primes heterogeneities in totipotency. We used machine learning to identify totipotency gene regulatory networks, including stage-specific transposable elements and putative transcription factors. CRISPR activation of a combination of these identified transcription factors induced totipotency activation in mouse embryonic stem cells. Together with single-cell co-profiles of multiple histone modifications, we developed a model that predicts the earliest cell branching towards the inner cell mass and the trophectoderm in latent multimodal space and identifies regulatory elements and previously unknown lineage-specifying transcription factors. Our work provides insights into single-cell epigenetic reprogramming, multimodal regulation of cellular lineages and cell-fate priming during mouse pre-implantation development.


Conflict of interest statement

Competing interests: The authors declare no competing interests.

Figures

Fig. 1
Fig. 1. TACIT provides a single-cell genome-coverage landscape of resetting histone modifications during mouse embryo pre-implantation development.
a, Schematic of the TACIT workflow. Cells were lightly fixed in cold methanol to retain intact nuclei. Permeabilized cells were incubated with antibodies, PAT–MEA/B (PAT assembled with MEA and MEB adaptors) and tagmentation buffer before manual pipetting of single cells into a well of 96-well plate. A brief lysis step (at 55 °C for 15 min with 0.1 mg ml–1 proteinase K) was key to minimize loss of material and to obtain genome-coverage reads per cell. b, Schematic of the TACIT experimental design in early mouse embryos. Cells from zygote, 2cell, 4cell, 8cell, morula and blastocyst stages were collected and subjected to genome-wide localization profiling of histone modifications as indicated at single-cell resolution with TACIT. c, Track view showing TACIT signals of various histone modifications in mouse embryos. Public datasets for H3K4me3, H3K27ac, H3K36me3, H3K27me3, H3K9me3 and H2A.Z were downloaded from the NCBI Gene Expression Omnibus (GEO) database (accessions GSE71434, GSE72784, GSE207222 (both H3K27ac), GSE112835, GSE76687, GSE97778 and GSE51579, respectively). Agg, aggregate. d, Violin plots displaying the distribution of non-duplicated reads per cell for each histone modification across different stages. The median number of non-duplicated reads for each stage from at least three independent experiments are shown on the top. The boxes in violin plots indicate upper and lower quartiles (25th and 75th percentiles). e, UMAP visualization of high-quality single-cell data of H3K4me1 (n = 392), H3K4me3 (n = 635), H3K27ac (n = 538), H3K27me3 (n = 549), H3K36me3 (n = 579), H3K9me3 (n = 496) and H2A.Z (n = 560) modifications. Each dot represents an individual cell and is coloured by stages (left) and clusters (C1–C4; right). f, Euclidean distance between individual cells for each histone modification across different stages. Source data
Fig. 2
Fig. 2. Single-cell ensembles of integrated histone modifications reveal early heterogeneities in 2cell embryos.
a, Schematic of the CoTACIT workflow. PAT-bar 1, PAT assembled with barcoded T5-1 and T7-1 adaptors; PAT-bar 2, PAT assembled with barcoded T5-2 and T7-2 adaptors. b, Co-embeddings of TACIT and CoTACIT data. Each dot represents an individual cell and is coloured by stages and methods. c, Schematic of the pipeline used to generate synthetic cells. d, Top, UMAP visualizations of interpolated 155 single cells based on WNN analysis, which combined all six modalities. Cells are coloured by stages. Bottom, boxplots displaying the average expression of ZGA-related genes for synthetic cells up to the 4cell stage. Genes exhibiting significant upregulation subsequent to the initiation of both minor and major ZGA were categorized as ZGA-related. e, Emission probabilities for each synthetic cell by single-cell ChromHMM. Chromatin-state definitions (left) and genome coverage (right) for each state are annotated. Chromatin-state definitions were determined on the basis of histone-modification probabilities and annotations of genic and non-genic elements (Extended Data Fig. 7a). f, Gene expression associated with chromatin states. Chromatin regions were linked to the nearest genes using Homer. The following number of genomic bins were used: multivalent (Multi), 278; promoter (weak) (Pr-W), 2,920; promoter (strong) (Pr-S), 36,352; enhancer (weak) (En-W), 16,026; enhancer (strong) (En-S), 59,573; gene body (poised) (Ge-P), 12,691; gene body (active) (Ge-A), 20,314; heterochromatin (polycomb) (He-P), 15,246; heterochromatin (H3K9me3) (He-K9), 11,913; and heterochromatin (K27+K9) (He), 23,039. g, Track view displaying chromatin-state annotations in representative loci for synthetic cells. Colours are as for e. For boxplots (d,f), the centre lines indicate the median, box limits indicate the first and third quartiles, and whiskers indicate 1.5× the interquartile range (IQR). Source data
Fig. 3
Fig. 3. Validation of 2cell stage heterogeneity with embryo-barcoded TACIT and CoTACIT.
a, Connected UMAP visualization for early 2cell CoTACIT data (n = 89). Lines connect the same cells across modalities. Cells are coloured by WNN clusters. b, Violin plots showing histone-modification signals around major ZGA genes in 2cell 1 and 2cell 2 clusters. c, Track views of histone modifications on a representative locus in 2cell 1 (n = 55) and 2cell 2 (n = 34) single cells, with violin plots showing breadth scores across all genomic peaks. Box plots indicate the median (centre line), quartiles (limits) and 1.5× IQR (whiskers). NS, not significant. d, The workflow of in vivo and IVF embryo-barcoded TACIT experiments. e, Top, UMAP plots of single cells from in vivo early and late 2cell embryos. The fraction of embryos for which two cells are assigned to the same or different clusters are coloured in the bar graph. Bottom, violin plots showing the major ZGA score. Early 2cell (H3K27ac, 144; H3K4me3, 172); late 2cell (H3K27ac, 92; H3K4me3, 78). f, Linked dot plots of major ZGA scores for cells from the same in vivo embryo, with the black line linking the average scores. g, Top, UMAP plots of single cells of IVF early and late 2cell embryos. The fraction of embryos for which two cells are assigned to the same or different clusters are coloured in the bar graph. Bottom, violin plots showing the major ZGA score. Early 2cell (H3K27ac, 166; H3K4me3, 138); late 2cell (H3K27ac, 114; H3K4me3, 106). h, Linked dot plots of major ZGA scores for cells from the same IVF embryo, with the black line linking the average scores. P values were calculated using two-sided Wilcoxon tests (b,c,eh). Source data
Fig. 4
Fig. 4. Integrated single-cell hidden chromatin states define totipotency and putative regulators.
a, UMAP plots of synthetic cells based on the posterior probabilities of ChromHMM-defined chromatin states. b, Schematic of the two strategies used for discovering potential classifier bins to define totipotency. Strategy 2 prioritizes 2,583 potential totipotency-related classifier bins. c, Venn diagram showing the overlap of totipotency-related classifier bins generated from the two machine-learning models. The P value was calculated using one-sided hypergeometric tests. d, Heatmaps displaying chromatin-state annotations in all 2,583 classifier bins for synthetic cells from strategy 2. The 2,583 classifier bins were grouped into two clusters using k-means clustering: one annotated as active in 2cell synthetic cells and the other as repressive in 8cell synthetic cells. e, TF motifs enriched on the active 2,583 classifier bins for each synthetic cell. The evaluation of totipotency by classifier bins for each synthetic cell is plotted on the right. TF motifs with both high enrichment (–log10(P) > 8) and expression (transcripts per million (TPM) > 2) in totipotent cells were selected as putative totipotency-related TFs and highlighted in bold. Representative, previously reported pluripotency-associated and lineage-associated TFs are also shown as control. P values were calculated using one-sided binomial tests. f, Ranking plots for the enrichment of different transposable elements in the 2,583 classifier bins. Enrichment was calculated using observed versus expected probability. Bold labels highlight key transposable elements that have been previously reported to be associated with totipotency. g, Heatmap showing the percentage of transposable-element copies that were annotated as promoter, enhancer, gene body, heterochromatin or quiescent/low states. Transposable elements enriched in the 2,583 classifier bins (log2(overexpression) > 1) are shown. Source data
Fig. 5
Fig. 5. Integration with single-cell CoTACIT multimodal profiles predicts chromatin states that prime the first cell-fate sorting towards ICM and TE cells.
a, A computational pipeline for constructing a random forest training model to identify classifier bins associated with lineage specification. b, Receiver operating characteristic of the random forest model. c, Fraction of classifier bins (n = 780) overlapping with ICM and TE differential expressed genes (DEGs). d, Heatmap displaying chromatin-state annotations in all 780 classifier bins. The 780 classifier bins were grouped into four clusters using k-means clustering. e, TF motifs identified during ICM or TE lineage specification. TF motifs with high enrichment (–log10(P) > 5) and expression (reads per kilobase million (RPKM) > 1.5 in Ribo-lite data) along lineage specification are highlighted in bold (for TE) or underline (for ICM). P values were calculated using one-sided binomial tests. f, Quantification of early embryo development from 36 to 108 h. Sample sizes are as follows: control (37, 40, 24), NANOG (35, 22, 29), ZFX (25, 25, 33), HNF4A (38, 26, 24), YY2 (44, 25, 35), TCF12 (33, 34, 21), CEBPB (14, 37, 32), BBX (31, 20, 31), SMAD2 (43, 41, 42), HBP1 (34, 28, 36), CDX2 (34, 29, 41), KLF6 (31, 15, 35), SOX15 (41, 35, 15), MED1 (27, 17, 33), ELF5 (36, 36, 24), HIF1A (24, 14, 40). Data from three replicate experiments are shown for each time point. g, Quantification of morula embryos that develop into normal or abnormal blastocysts. Numbers inside each bar indicate the number of embryos. P values (shown on the chart) were calculated using two-sided Chi-square tests. h, Top, schematic of the two classes of abnormal blastocysts after KD. Bottom, quantification of abnormal blastocysts with SOX2 or CDX2 cell misallocation or the presence of ICM SOX2 cells. The total number of blastocysts is shown. P values were calculated using two-sided G-tests. i, Immunofluorescence staining of mouse embryos at 108 h after fertilization. Shown are z projection 3D images and single-section immunofluorescence images. Representative images out of three independent experiments are shown. Asterisks, adjacent embryos; white arrowheads, CDX2+SOX2+ cells; green arrowheads, misallocated CDX2+ cells. Scale bar, 100 μm. Source data
Extended Data Fig. 1
Extended Data Fig. 1. Optimization of key steps in TACIT and data quality in mouse embryonic stem cells.
(a-b) Optimization of critical conditions for reverse crosslinking. Based on yielding DNA fragments of <1 kb (a) and non-duplicated reads per cell (b), the condition of incubation at 55 °C for 15 min with 0.1 mg/ml Proteinase K is chosen in TACIT experiments. The boxes in violin plots indicate upper and lower quartiles (25th and 75th percentiles). For gel source data, see Supplementary Fig. 1. The cell number for each group in (b) is 96. (c) Left, bioanalyzer DNA analysis of one example of TACIT libraries. Right, fragment length distribution of one example of TACIT libraries. (d) Track views showing H3K4me3, H3K27ac, H3K36me3, and H3K27me3 TACIT signals on representative locus in mouse embryonic stem cells (mESCs). ENCODE bulk data for H3K4me3, H3K27ac, H3K36me3, H3K27me3 ChIP-seq were downloaded from GSM1000124, GSM1000126, GSM1000109, and GSM1000089, respectively. (e) Hierarchical clustering of the aggregate TACIT single-cell profiling of different histone modifications using signals in peak regions. (f) Violin plot showing the fraction of reads in peak (FRiP) for single cell TACIT data, with simulated random profiling as control. The boxes in violin plots indicate upper and lower quartiles (25th and 75th percentiles). The cell number for each group is below: H3K4me3 (94), H3K27ac (94), H3K36me3 (93), H3K27me3 (92), and random (96). (g) Distribution of non-duplicated reads for single cells in TACIT, sc-itChIP-seq, CoBATCH, scCUT&Tag, and droplet-based scCUT&Tag datasets. TACIT, sc-itChIP-seq, and CoBATCH datasets are derived from mouse embryonic stem cells, scCUT&Tag dataset is from K562 cells, and the two droplet-based scCUT&Tag datasets are from human peripheral blood mononuclear cells and mouse brain cells, respectively. sc-itChIP-seq (n = 1,903), CoBATCH (n = 2,161), scCUT&Tag (n = 217), and two droplet-based scCUT&Tag datasets (n = 133,696 and 2,028) were downloaded from GSE124557, GSE129335, GSE124557, GSM5034344, and GSE157637 respectively. Cells with fewer than 100 non-duplicated reads in droplet-based scCUT&Tag datasets were filtered out. The boxes in violin plots indicate upper and lower quartiles (25th and 75th percentiles). Source data
Extended Data Fig. 2
Extended Data Fig. 2. TACIT experiments with mouse embryos.
(a) Representative images of embryos used for TACIT library preparation. The two pronucleus of the zygote are indicated with the white arrows. Shown are representative images from three biological replicates. Scale bars, 20 μm. (b) Representative images of tagemented single cells before reverse crosslinking and lysis. Shown are representative images from three biological replicates. Scale bars, 50 μm. (c) Exemplification of scatter plots showing Pearson correlation coefficient for both technical replicates (H3K27me3) and biological replicates (H3K27ac) in mouse embryos. Technical replicates represent two TACIT libraries generated from the same batch of embryos, while biological replicates represent two independent TACIT experiments at the matching stages. The correlation is calculated based on aggregate TACIT signals in 5-kb bins of the genome. (d) Pearson correlation between aggregated H3K4me3, H3K27ac, and H3K9me3 TACIT profiles and corresponding low-input ChIP-seq data. The correlation is calculated based on signals in genome-wide 10-kb or 20-kb bins. (e) Track views displaying aggregate histone modification signals on representative loci. Active histone modifications, such as H3K4me1, H3K4me3, H3K27ac, and H3K36me3, exhibit non-canonical, broad binding patterns before ZGA. (f) Scatter plots showing Pearson correlation coefficient between aggregated H3K36me3 signals of TACIT and itChIP for zygote and 2-cell stage. The correlation is calculated based on signals in genome-wide 20-kb or 50-kb bins. (g) Receiver operating characteristics curves for H3K36me3 TACIT data. Peaks of itChIP-seq data were used as the gold standard (15,069 for zygote, 12,035 for 2-cell). (h) Genome coverage for aggregate profiles. For each histone modification, genome coverage is defined as the proportion of the genome covered by peaks for aggregate cells each stage. (i) Median genome coverage per cell in TACIT experiments. To evaluate H3K4me1 genome coverage for single cells, the genome was firstly binned into 200 bp and bins with H3K4me1 signals≥1 were defined as H3K4me1 covered bins. Similar analyses were applied for H3K4me3, H3K27ac, H3K36me3, H3K27me3, H3K9me3, and H2A.Z. Source data
Extended Data Fig. 3
Extended Data Fig. 3. UMAP embedding of TACIT data.
(a-b) UMAP visualization of all TACIT profiles for each developmental stage based on histone modification signals either genome-wide (a) or within peaks (b). Cell-to-cell variability within a given stage increases gradually as embryos develop. Heterogeneities within zygotic cells may arise likely because these cells come from different pronuclear stages (PN0/1 to PN5). For blastocysts, ICM and TE cells are annotated manually based on histone modification signals around ICM and TE feature genes. Source data
Extended Data Fig. 4
Extended Data Fig. 4. Data quality of CoTACIT with mouse embryos.
(a) Top, bioanalyser and tapestation plots of one example of CoTACIT libraries. Bottom, fragment lengths distribution of one example. (b) Track view displaying aggregate CoTACIT profiles of different histone modifications on representative loci. (c) Hierarchical clustering of the aggregate TACIT, CoTACIT, and corresponding low-input ChIP-seq data using signals in aggregate peaks or genome-wide 20-kb bins. Source data
Extended Data Fig. 5
Extended Data Fig. 5. Quality controls in generation of synthetic cells.
(a) Combined UMAP visualization of the scRNA-seq dataset from this study (n = 1012) and data from by Deng et al.. Each dot represents an individual cell and is colored by technologies (left) or stages (right). (b) Heatmap showing the Spearman correlation coefficients between H3K4me3 TACIT cells and RNA synthetic cells at each developmental stage. (c) Violin plots showing Spearman correlation coefficients between H3K27ac profiles from TACIT and CoTACIT that are linked to the same scRNA-seq synthetic cells after integration analysis. Box plots centre lines indicate the median, box limits indicate the first and third quartiles, and whiskers indicate 1.5× IQR.The TACIT cell number for each stage is below: 2-cell (66), 4-cell (72), 8-cell (89), morula (121), and blastocyst (166). The CoTACIT cell number for each stage is below: 2-cell (52), 4-cell (70), 8-cell (118), morula (190), and blastocyst (197). (d) UMAP visualization of interpolated single cells on the basis of histone modifications. (e) Hierarchical clustering of synthetic cells from 2-cell, 4-cell, 8-cell, morula and blastocyst embryos. (f) Heatmap showing Pearson correlation of epigenetic profiles for synthetic cells at zygote, 2-cell, 4-cell and 8-cell stages. Correlation coefficients are labeled on the plots. (g) Track view showing aggregated TACIT data of all six histone modifications in 2cell_2 and 4cell_4. (h) Scatter plots showing Spearman correlation between H3K4me3 and H3K27ac signals in synthetic cells at 2-cell and 4-cell stages. Histone modification signals were calculated in ±50 kb regions flanking the TSS of genes exclusively expressed in early-stage embryos. (i) Comparison between H3K27ac and H3K27me3 profiles based on genome-wide distribution for synthetic cells across different developmental stages. Each line represents one synthetic cell. (j) Comparison between H3K27ac and H3K27me3 profiles based on signals in peak regions for synthetic cells across different developmental stages. Each line represents one synthetic cell. Source data
Extended Data Fig. 6
Extended Data Fig. 6. Characterization of feature chromatin states during mouse preimplantation development.
(a) Annotation of genic and non-genic elements for each ChromHMM-trainned chromatin state. Chromatin state definitions are labeled on the left for each synthetic cell. (b) Emission probabilities for random control synthetic cells by single-cell ChromHMM. Random control synthetic cells are generated via randomly merging interpolated cells, rather than based on hierarchical clustering. Chromatin state definitions (left) and genome coverage (right) for each state are annotated. (c) Violin plots displaying histone modifications on multivalent regions for all single cells at the zygotic stage. Histone modifications are also calculated in a list of random regions at the same length as multivalent regions, served as a control. (d) Genomic annotation of multivalent regions. (e) Sankey diagram showing chromatin state dynamics of multivalent regions. Each line represents a 200-bp bin categorized by ChromHMM. Multi, multivalent; Pr-W, promoter (weak); Pr-s, promoter (strong); En-W, enhancer (weak); En-S, enhancer (strong); Ge-P, gene body (poised); Ge-A, gene body (active); He-P, heterochromatin (polycomb); He-K9, heterochromatin (H3K9me3); He, heterochromatin (K27 + K9); Quies, quiescent/low. (f) Emission probabilities for GV-oocyte, Zygote, and 2-cell by ChromHMM. Low-input ChIP-seq profiles are either downloaded from GSE76687, GSE71434, GSE207222, GSE112834, GSE98149, or obtained with itChIP-seq in this work. (g) TF motifs identified from chromatin regions annotated as promoters, enhancers or gene bodies for synthetic cells. Representative known regulators for totipotency and pluripotency are shown. Chromatin regions annotated as promoters, enhancers or gene bodies were intersected with ATAC-seq peaks to refine the regions for TF motif enrichment analysis via Homer. P value, one-sided binomial test. Source data
Extended Data Fig. 7
Extended Data Fig. 7. Early 2-cell embryo CoTACIT data facilitates identification of promoter-enhancer pairs.
(a) Boxplots displaying the average expression of ZGA related genes for single cells across developmental stages. Box plots center lines indicate the median, box limits indicate the first and third quartiles, and whiskers indicate 1.5× IQR. The cell number for each stage is below: zygote (95), early 2-cell (59), late 2-cell (77), 4-cell (164), 8-cell (120), morula (251), early blastocyst (167), and late blastocyst (79). (b) Non-duplicated reads per cell in CoTACIT experiments (n = 89). The boxes in violin plots indicate upper and lower quartiles (25th and 75th percentiles). (c) Spearman correlation of aggregated profiles of CoTACIT, TACIT, and published datasets in genome-wide 10-kb bin. (d) Track view displaying aggregate CoTACIT and TACIT signals of different histone modifications on representative loci at the 2-cell stage. (e) Carmer’s V similarity between targeted combinations in promoter, gene body, distal, LINE, SINE, and LTR regions. Promoter regions are defined as the ± 1 kb genomic regions flanking all transcription start sites (TSS) in mm10 genome. The boxes in violin plots indicate upper and lower quartiles (25th and 75th percentiles). P value, two-sided Kruskal-Wallis test. All 89 CoTACIT single-cell profiles are used for this analysis. (f) UMAP projection of H3K27ac for cells from zygote to Late-2-cell stages. Cells are colored by developmental stages. TACIT (n = 90) and CoTACIT (n = 89) profiles are both used for this analysis. (g) UMAP projection of RNA for cells from zygote to Late-2-cell stages. Cells are colored by developmental stages. (h) Schematic for breadth score definition. (i) Violin plots showing the distribution of H3K4me3 and H3K27ac breadth scores for single cells. The boxes in violin plots indicate upper and lower quartiles (25th and 75th percentiles). The H3K4me3 TACIT cell number for each stage is below: zygote (20), 2-cell (24), 4-cell (72), 8-cell (88), morula (192), and blastocyst (239). The H3K27ac TACIT cell number for each stage is below: zygote (24), 2-cell (66), 4-cell (72), 8-cell (89), morula (121), and blastocyst (166). (j) Left, heatmap of H3K4me3, H3K27ac, and H3K27me3 signals around ZGA related genes (gene body±10 kb). Rows are genes and columns cells, with cells ordered along the pseudotime. Genes are grouped using k-means clustering based on H3K4me3 and H3K27ac signals. Right, aggregate curves showing dynamics of median H3K4me3, H3K27ac, and H3K27me3 signals along the pseudotime. (k) Schematic of identifying potential promoter-enhancer pairs with Cicero. TSS-proximal H3K4me3 signals and distal-confined H3K27ac signals for each single cell are merged and Cicero is used to identify co-occurrence of H3K4me3 and H3K27ac signals in cells within 2cell_1 or 2cell_2 clusters. Only pairs linking H3K4me3 and H3K27ac peaks are defined as promoter-enhancer pairs and used for following analysis. (l) Distribution of the number of Cicero-linked promoter-enhancer pairs for promoters (left) or enhancers (right). (m) Left, Z-score heatmap showing H3K4me3, H3K27ac, H3K27me3 signals (gene body±10 kb), gene expression and Cicero defined co-binding score of identified ZGA related promoter-enhancer pairs. Rows are promoter-enhancer pairs and columns cells, ordered by pseudotime. Promoter-enhancer pairs are grouped using k-means clustering based on H3K4me3 and H3K27ac signals. Right, aggregate curves showing median RNA, H3K4me3, and H3K27ac signals along the pseudotime. (n) Left, heatmap of H3K4me3, H3K27ac signals, and gene expression for MERVL related promoter-enhancer pairs. Rows are promoter-enhancer pairs and columns cells, with cells ordered along the pseudotime. Promoter-enhancer pairs are grouped using k-means clustering based on H3K4me3 and H3K27ac signals. Right, aggregate curves showing median RNA, H3K4me3, and H3K27ac signals along the pseudotime. (o) Examples of inferred promoter-enhancer pairs, in which MERVL functions as promoters (named as MERVL-promoter, top) or as enhancers (named as MERVL-enhancer, bottom) in 2cell_1 or 2cell_2 clusters. Loops identified in public HiC data are shown underneath. (p) Scatter plots showing the enrichment and expression of transcription factors (TFs) enriched in MERVL-promoter paired enhancers. TFs expressed at the 2-cell stage (FPKM ≥ 2) and with motif enrichment P value < 1 × 10 − 3 are denoted. P value, one-sided binomial test. (q) GO term enrichment (Biological Processes) of MERVL-enhancer linked genes that are highly expressed in 2cell_1 (low ZGA) (left) or highly expressed in 2cell_2 (high ZGA) (right). Top 5 enriched GO terms are shown. P value, one-sided binomial test. Source data
Extended Data Fig. 8
Extended Data Fig. 8. identification and in vitro functional validation of totipotency-related TFs in totipotency induction.
(a) Clustering synthetic cells by posterior probability of different chromatin states in transcription start site (TSS) regions. (b) Progressive changes in expression of totipotency related genes (left) or progressive establishment of totipotency-related chromatin states (right) from zygote to 8-cell developmental stages. The median expression of totipotency related genes is calculated for each synthetic cell (black line, RNA). (c) Bar charts showing enrichment of 2,583 classifier bins in promoter, gene body, distal, and repeat regions. Promoter is defined as the ± 1 kb genomic region around TSS. (d) Overlap of the active cluster of totipotency-related classifier bins (see Fig. 4e) with totipotency feature genes. The totipotency gene list was downloaded from Hui Shen et al. 2021. (e) Bar plots showing GO terms enriched in 120 totipotency-related TFs (listed in Supplementary Table 8). P value, one-sided binomial test. (f) Venn diagram showing overlap of TF motifs enriched on totipotency-related classifier bins generated from the two machine learning models. Both known totipotency-related TF motifs (ZSCAN4 and NR5A2) and newly identified totipotency-potential TF motifs (MEF2D, LBX1, ESR1, ETS1, CEBPG) are shown. P value, one-sided hypergeometric test. (g) Schematic for CRISPRa experiment in mESCs. (h) Scatter plot showing the sgRNA UMI fraction within a given cell (x axis) as a function of the log2 (UMI per sgRNA) received in that cell (y axis). Each dot represents an individual sgRNA species in a specific cell. sgRNAs with less than 16 UMI were not considered for further analyses. (i) Data quality control for detected sgRNA species per cell. (j) UMAP showing the individual cells in this study (n = 10,178) and public scRNA-seq datasets. Public scRNA-seq data were downloaded from GSM5195024.TBLCs, totipotent blastomere-like cells. PSCs, pluripotent stem cells. (k) Pseudotime analysis for individual cells shown in (c). (l) Expression level of totipotency gene signature along the pseudotime of totipotency activation. (m) Cell distribution along the pseudotime of with the increasing of cell totipotency. (n) The proportion of cells receiving different kinds of sgRNAs for pluripotent, intermediate, and TBLCs. NTC, non-targeting control. PC, positive control with DUX and ZSCAN4. (o) The overall perturbation effect ranking lists identified by MUSIC (Duan et al., PMID: 31110232) using the cells taking only one sgRNA in the CRISPRa experiment. (p) Heatmap showing the gene–gene perturbation relationships for candidate TFs and positive control TFs (ZSCAN4 and DUX). (q) Violin plot showing the scaled totipotency score for cells with different combination of gene perturbarions. Box plots center lines indicate the median, box limits indicate the first and third quartiles, and whiskers indicate 1.5× IQR. The cell number for each of the eight perturbation combinations is as follows: 1,946, 3,734, 746, 1,068, 651, 1,119, 800, and 1,588. (r) Projection of cells with different combination of gene perturbarions shown in (j) along pseudotime. The cell with median pseudotime distance was labeled by red for each group. Source data
Extended Data Fig. 9
Extended Data Fig. 9. scChromHMM defined feature chromatin states related to ICM and TE specification.
(a) Top, UMAP projection of gene expression of blastocysts (n = 246). Cells are defined as ICM or TE cells based on expression of ICM or TE marker genes. Bottom, expression of representative marker genes of ICM (Klf4, Etv5, Utf1, and Pou5f1) or TE (Cdx2, Id2, Gata3, and Krt18) overlaied on single cell RNA UMAP. (b) Examples of track views on representative gene loci with ChromHMM defined chromatin stages. Top: Aggregate profiles of six histone modifications in ICM and TE cells. Bottom: ChromHMM annotations. (c) Spearman correlation bewteen aggregated ICM and TE H3K4me3, H3K37me3, and H3K9me3 TACIT profiles and corresponding low-input ChIP-seq data. The correlation is calculated based on signals in genome-wide 50-kb bins. (d) Emission probabilities for histone modifications in 12 ChromHMM chromatin states, with labels on the right. (e) Receiver operating characteristic (ROC) of the random forest model. Bam files without one of the six histone modifications are used to construct the random forest model. (f) Genomic distribution of the 780 classifier bins relative to TSS. (g) Enriched GO terms of the Mouse Phenotype Single KO items for the 780 classifier bins. P value, one-sided binomial test. (h) The average Cramer’V similarity between each interpolated cell and ICM or TE cells. Interpolated cells of higher similarity to ICM or TE cells are categorized as ICM-potential or TE-potential cells, respectively. Zygote, 2cell_1, 2cell_2, 4cell_2, 8cell_1, and 8cell_2 exhibit comparable similarity to both cell types, indicating an undefined cellular potential. (i) Bar plots showing GO terms enriched in 59 ICM-related TFs (top) and 42 TE-related TFs (bottom). P value, one-sided binomial test. Source data
Extended Data Fig. 10
Extended Data Fig. 10. Loss-of-function validation of potential TE and ICM regulators.
(a) Bar charts showing the expression of target TFs in both NC and experimental groups of embryos based on single-embryo RNA-seq. P value was determined by two-side t-test. Error bars represent median values ± SEM. The embryo number for each group in 8 C is as below: NANOG KD (20), ZFX KD (15), YY2 KD (26), TCF12 KD (19), CEBPB KD (19), BBX KD (14), SMAD2 KD (15), HBP1 KD (16), CDX KD (12), SOX15 KD (14), MED1 KD (10), NC (19). The embryo number for each group in blastocyst is as below: HNF4A (19), KLF6 KD (10), ELF5 KD (20), HIF1A KD (13), and NC (15). (b) Stereomicroscopic representative images of embryos at the indicated time points with different siRNAs. Representative images out of three independent experiments are shown. Scale bar, 100 μm. hpf, hours post fertilization. (c) Immunofluorescence staining of mouse embryos at 108 hpf. Z-projection and single-section immunofluorescence images of non-target-, NANOG-, SMAD2-, HNF4A-, TCF12-, HBP1-, CDX2-, MED1- and ELF5-siRNA injected embryos, showing trophectoderm fate (CDX2, green), inner cell mass fate (SOX2, magenta), and DNA (DAPI, cyan). White arrowheads indicate the decrease in SOX2+ cells. Representative images out of three independent experiments are shown. Asterisks indicate the adjacent embryos. Scale bar, 100 μm. (d) UMAP showing individual embryos colored by specific knock-down (KD) TFs for 8 C embryos. The large colored dots indicate the median distribution of all embryos of each specific TF KD. (e-f) Violin plots showing the expression level of ICM signature genes (e), and TE signature genes (f) in 8-cell embryo RNA-seq data between non-targeting and TF KD groups. P value, two-sided Mann-Whitney test. Box plots center lines indicate the median, box limits indicate the first and third quartiles, and whiskers indicate 1.5× IQR. The embryo number for each group in 8 C is as below: NANOG KD (20), ZFX KD (15), YY2 KD (26), TCF12 KD (19), CEBPB KD (19), BBX KD (14), SMAD2 KD (15), HBP1 KD (16), CDX2 KD (12), SOX15 KD (14), and NC (19). (g) UMAP showing individual embryos colored by specific KD TFs for blastocyst embryo. The large colored dots indicate the median distribution of all embryos of each specific TF KD. (h-i) Violin plots showing the expression level of ICM signature genes (h), and TE signature genes (i) in blastocyst embryo RNA-seq data between non-targeting and TF KD groups. P value, two-sided Mann-Whitney test. Box plots center lines indicate the median, box limits indicate the first and third quartiles, and whiskers indicate 1.5× IQR. The embryo number for each group in blastocyst is as below: HNF4A (19), KLF6 KD (10), ELF5 KD (20), HIF1A KD (13), and NC (15). (j-k) Smoothed heatmap showing the SCENIC TF activity score for different groups in 8-cell (j) and blastocyst embryos(k) RNA-seq data. Source data

References

    1. Burton, A. & Torres-Padilla, M. E. Chromatin dynamics in the regulation of cell fate allocation during early embryogenesis. Nat. Rev. Mol. Cell Biol.15, 723–734 (2014). - PubMed
    1. Zhang, Y. & Xie, W. Building the genome architecture during the maternal to zygotic transition. Curr. Opin. Genet. Dev.72, 91–100 (2022). - PubMed
    1. Hemberger, M., Dean, W. & Reik, W. Epigenetic dynamics of stem cells and cell lineage commitment: digging Waddington’s canal. Nat. Rev. Mol. Cell Biol.10, 526–537 (2009). - PubMed
    1. Zernicka-Goetz, M., Morris, S. A. & Bruce, A. W. Making a firm decision: multifaceted regulation of cell fate in the early mouse embryo. Nat. Rev. Genet.10, 467–477 (2009). - PubMed
    1. Posfai, E. et al. Evaluating totipotency using criteria of increasing stringency. Nat. Cell Biol.23, 49–60 (2021). - PubMed

MeSH terms

LinkOut - more resources