. 2025 Apr;640(8057):146-154.
doi: 10.1038/s41586-025-08592-0. Epub 2025 Feb 26.

A compendium of human gene functions derived from evolutionary modelling

Collaborators, Affiliations

A compendium of human gene functions derived from evolutionary modelling

Marc Feuermann et al. Nature. 2025 Apr.

Abstract

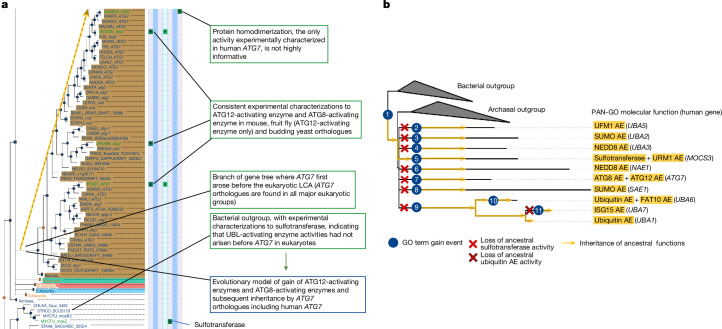
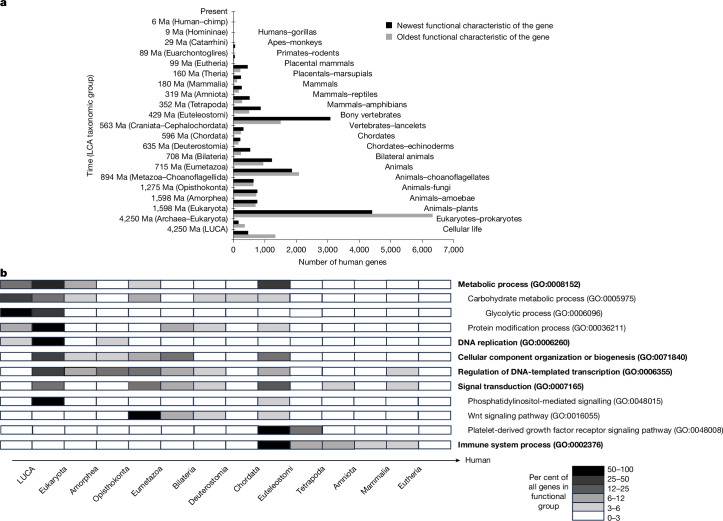
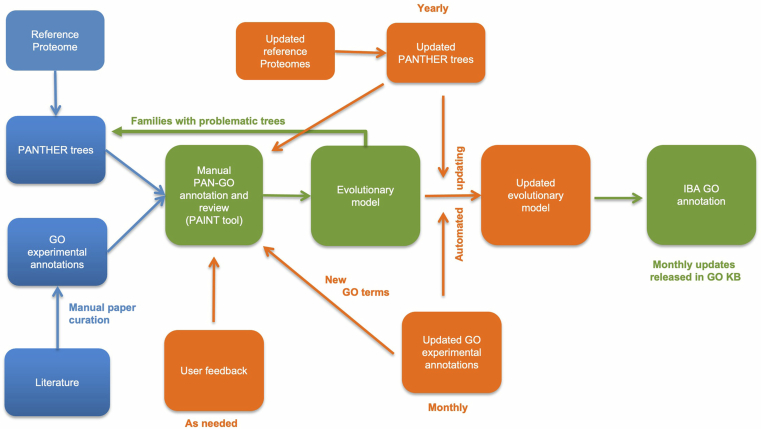
A comprehensive, computable representation of the functional repertoire of all macromolecules encoded within the human genome is a foundational resource for biology and biomedical research. The Gene Ontology Consortium has been working towards this goal by generating a structured body of information about gene functions, which now includes experimental findings reported in more than 175,000 publications for human genes and genes in experimentally tractable model organisms1,2. Here, we describe the results of a large, international effort to integrate all of these findings to create a representation of human gene functions that is as complete and accurate as possible. Specifically, we apply an expert-curated, explicit evolutionary modelling approach to all human protein-coding genes. This approach integrates available experimental information across families of related genes into models that reconstruct the gain and loss of functional characteristics over evolutionary time. The models and the resulting set of 68,667 integrated gene functions cover approximately 82% of human protein-coding genes. The functional repertoire reveals a marked preponderance of molecular regulatory functions, and the models provide insights into the evolutionary origins of human gene functions. We show that our set of descriptions of functions can improve the widely used genomic technique of Gene Ontology enrichment analysis. The experimental evidence for each functional characteristic is recorded, thereby enabling the scientific community to help review and improve the resource, which we have made publicly available.


Conflict of interest statement

Competing interests: The authors declare no competing interests.

Figures

Fig. 1
Fig. 1. PAN-GO annotation process illustrated using the UAE family.
a, View of the PAINT software tool (Methods) showing the process of creating a function evolution model for the human ATG7 gene (top) that integrates function information from related genes. The phylogenetic tree (left) shows the evolutionary relationships between genes found in different organisms. Tree nodes represent speciation events (circles) and gene duplication events (squares); extant genes are labelled with the UniProt five-letter species code and gene symbol when available. For each extant gene, the sparse experimental function annotations are shown on the right (green squares, each column is a distinct GO class). Information in the gene tree and primary GO annotations (green callouts) is used to construct a parsimonious model for function evolution (bottom callout, dark blue), in which the selected functional characteristics first arose in an ancestral, ATG7-like gene. These functions were then transmitted by inheritance to the human ATG7 gene (dashed yellow arrow). b, The PAN-GO evolutionary model and PAN-GO MF annotations for all human genes in the UAE family. Gene duplication events and functional evolution have resulted in ten human genes that serve as activating enzymes (AEs) with different functions at the molecular (shown here), cellular and organism levels (see full model at https://pantree.org/tree/family.jsp?accession=PTHR10953). The PAN-GO function evolution model is shown by circles indicating gains in function, with crosses indicating losses of function and orange arrows indicating inheritance of ancestral function. The LCA of the family had ‘sulfotransferase activity’ (gain labelled 1), which was passed on to the human MOCS3 gene (arrow leading from 1), but this function was modified in other descendants (losses and gains labelled 2–11) to create the canonical UAEs of varying specificities for different UBLs. For example, human UBA5 is specific for the UBL called UFM1. Branch lengths represent the numbers of amino-acid substitutions per site. The tree was drawn using the iToL tool.
Fig. 2
Fig. 2. Sources of experimental evidence for PAN-GO annotations.
Venn diagram showing the number of PAN-GO human gene annotations according to the source of the experimental evidence used for the PAN-GO annotation.
Fig. 3
Fig. 3. Overview of the set of human protein-coding gene functions categorized by high-level GO classes.
a, Human genes categorized by MF (activities of encoded proteins at the molecular level) for the 12,117 genes with an MF annotation in PAN-GO. b, Human genes categorized by BP (larger system functions to which a protein contributes) for the 13,982 genes with a BP annotation in PAN-GO. For each panel, the areas are proportional to the number of genes in a given functional category. Colours correspond to a few broad categories that do not correspond exactly to GO classes but serve to help organize the GO classes. Note that for the GO classes, some are subcategories of others, and in those cases, annotations are assigned to only the most specific category. For example, a gene annotated with ‘small-molecule metabolic process’ will not be included in the more general ‘metabolic process’. Note also that a gene can be assigned to multiple categories if it has annotations to distinct GO classes that are in different categories.
Fig. 4
Fig. 4. Distribution of the age of human gene functions.
Most human gene functions evolved from very distant ancestors. a, Distribution of the time periods at which human genes evolved their present-day functions as assessed using two measures: the overall function of a gene (black bars, considering all functional characteristics) and the oldest functional characteristic of a gene (grey bars). Black bars indicate the most recent (newest) functional characteristic to arise in the evolutionary model for that gene, whereas grey bars indicate the age of the most ancient (oldest) functional characteristic among all the functional characteristics for that gene. As shown in Fig. 1, each evolutionary event in our models is mapped to a branch of a gene tree, which represents a period of time separating the LCAs of two different taxonomic groups; the evolution of each functional characteristic is assigned to the corresponding time interval (see Methods for details). As an additional reference, LCAs are expressed in more commonly recognized terms towards the right side. b, Age distributions for different types of human gene functions; each time interval is shaded according to the fraction of genes that evolved a given functional type during that interval. Different types of functions display substantially different age distributions, with some basic cellular metabolic functions in humans having remained largely unchanged over billions of years, whereas other groups, such as regulation of transcription and immune processes, have undergone substantial recent evolutionary change. Higher-level functional types are indicated in bold, with more specific subtype names indented below. Taxonomic names are from NCBI Taxonomy, except Amorphea, the group that includes the Amoebozoa and Opisthokonta (fungi and animals). Note that different functional characteristics of the same gene may have evolved at different times. Ma, millions of years ago.
Extended Data Fig. 1
Extended Data Fig. 1. Overview of process for creating the set of human gene functions.
First, experimental results from the scientific literature are captured as primary GO annotations, and stored in the GO knowledgebase (GO KB). The next step is phylogenetic integration: a massive corpus of primary annotations for genes in multiple different organisms was integrated using phylogenetic trees that represent the evolutionary relationships between genes. For each gene family tree, selected primary annotations are used to construct an explicit evolutionary model of gains and losses of gene function along branches of the phylogenetic tree, and the evolutionary model is then used to create the integrated PAN-GO annotations for human genes. The set of human gene functions reported here comprises nearly 69,000 integrated annotations.
Extended Data Fig. 2
Extended Data Fig. 2. Breadth of annotation coverage of human genes as measured by the number of different aspects of GO (MF, BP and CC) to which a given gene is annotated.
For comparison with PAN-GO, two other sources of GO annotations in the GO knowledgebase are shown: primary annotations for human genes (EXP) and computationally predicted annotations (IEA).
Extended Data Fig. 3
Extended Data Fig. 3. Evenness of annotation coverage as measured by the distribution of distinct GO terms annotated to each human gene.
Distributions are shown for PAN-GO annotations, experimental annotations (EXP) and computationally predicted annotations (IEA). Before counting distinct GO terms for genes, we made each set as non-redundant as possible, by removing annotations that are to the same or more general term than another annotation in that set (note that a more general term is implied by the more specific term in the ontology). Direct annotations to ‘protein binding’ (GO:0005515) have also been removed.
Extended Data Fig. 4
Extended Data Fig. 4. Process for creating, updating and releasing evolutionary models and PAN-GO (IBA) annotations derived from the models.
The central task is the software-assisted process of PAN-GO annotation and review using the PAINT tool. PAINT integrates the primary GO experimental annotations with the PANTHER trees built from UniProt Reference Proteomes (blue squares), allowing curators to construct an evolutionary model of each gene family, which is used to produce annotations in family members (green). Updates, both automated and curator-reviewed (orange squares), are made at each GO knowledgebase release to reflect changes in the underlying data (ontology and annotations), and upon release of new PANTHER versions.
Extended Data Fig. 5
Extended Data Fig. 5. Selection of GO classes (functional characteristics) for evolutionary modeling from among available classes with experimental evidence (primary GO annotations).
This figure shows part of the tree corresponding to PANTHER family PTHR14074 (which includes genes involved in recognition of viruses and other pathogens) in the PAINT tool. Out of over 40 BP classes associated with this family through primary GO annotations, only two have been selected for the evolutionary model: ‘antiviral innate immune response’ and ‘cytoplasmic pattern recognition receptor signaling pathway’ (red text). The other classes (black text) correspond to peripheral processes or phenotypes (A), or are related classes, parent or child classes of the most relevant classes (B) and have not been selected for the evolutionary model. Green squares indicate primary GO annotations for the gene in that position of the tree, and red circles highlight different BP classes annotated to the members of this family during GO primary annotation.

References

    1. Fields, S. & Johnston, M. Cell biology. Whither model organism research? Science307, 1885–1886 (2005). - PubMed
    1. Müller, B. & Grossniklaus, U. Model organisms—a historical perspective. J. Proteomics73, 2054–2063 (2010). - PubMed
    1. Venter, J. C. et al. The sequence of the human genome. Science291, 1304–1351 (2001). - PubMed
    1. Lander, E. S. et al. Initial sequencing and analysis of the human genome. Nature409, 860–921 (2001). - PubMed
    1. Mistry, J. et al. Pfam: the protein families database in 2021. Nucleic Acids Res.49, D412–D419 (2021). - PMC - PubMed