. 2025 Feb 27;24(1):59.
doi: 10.1186/s12943-025-02259-0.

Hsa_circ_0125356 promotes gemcitabine resistance by modulating WNT canonical and non-canonical pathways via miR-582-5p/FGF9 axis in non-small cell lung cancer

Affiliations

Hsa_circ_0125356 promotes gemcitabine resistance by modulating WNT canonical and non-canonical pathways via miR-582-5p/FGF9 axis in non-small cell lung cancer

Xinyue Du et al. Mol Cancer. .

Abstract

Background: Non-small cell lung cancer (NSCLC) is the leading cause of cancer morbidity and mortality worldwide. The prognosis of patients has been significantly improved by chemotherapy, but acquired drug resistance remains a major obstacle to NSCLC treatment. Circular RNAs (circRNAs), which act as miRNA or protein sponges, are critically associated with the development and chemotherapy resistance of NSCLC.

Methods: CircRNA sequencing was performed to analyze the differential expression of circRNAs between A549 and A549-GR cells. Chromogenic in situ hybridization (CISH) and immunohistochemistry (IHC) technologies were used to detect the expression of hsa_circ_0125356, miR-582-5p,and FGF9 in NSCLC tissues and para-carcinoma tissues. Fluorescence in situ hybridization (FISH), dual-luciferase reporter assays and RNA immunoprecipitation (RIP) were conducted to evaluate the expression and regulation of hsa_circ_0125356, miR-582-5p, and FGF9. Furthermore, the regulation of hsa_circ_0125356/miR-582-5p/FGF9 on gemcitabine sensitivity was confirmed by TUNEL, Transwell, EdU, CCK8 and immunohistochemistry.

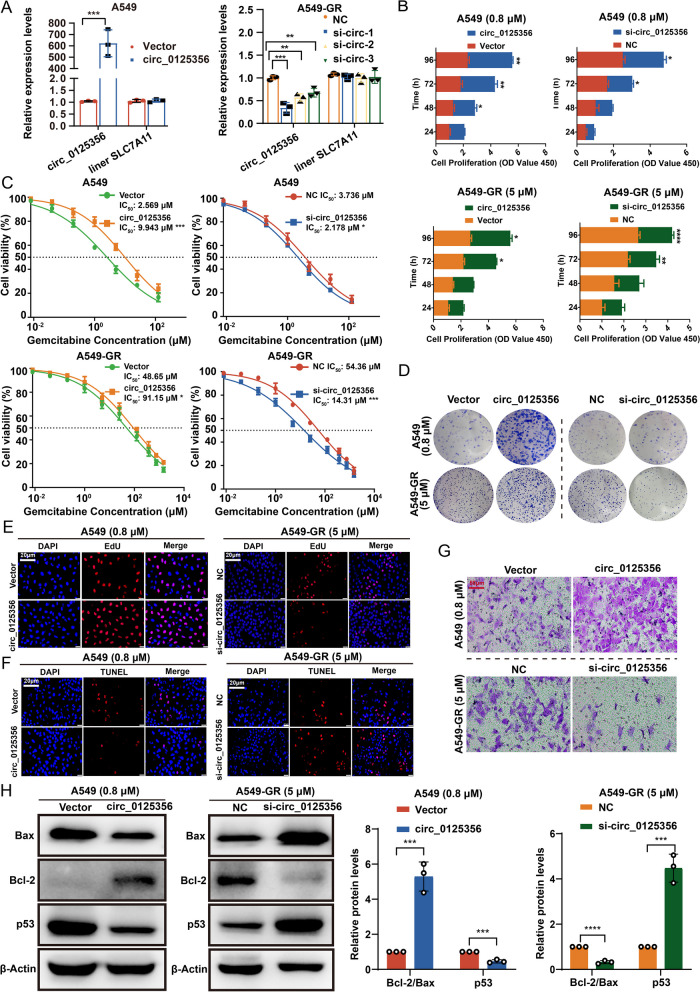
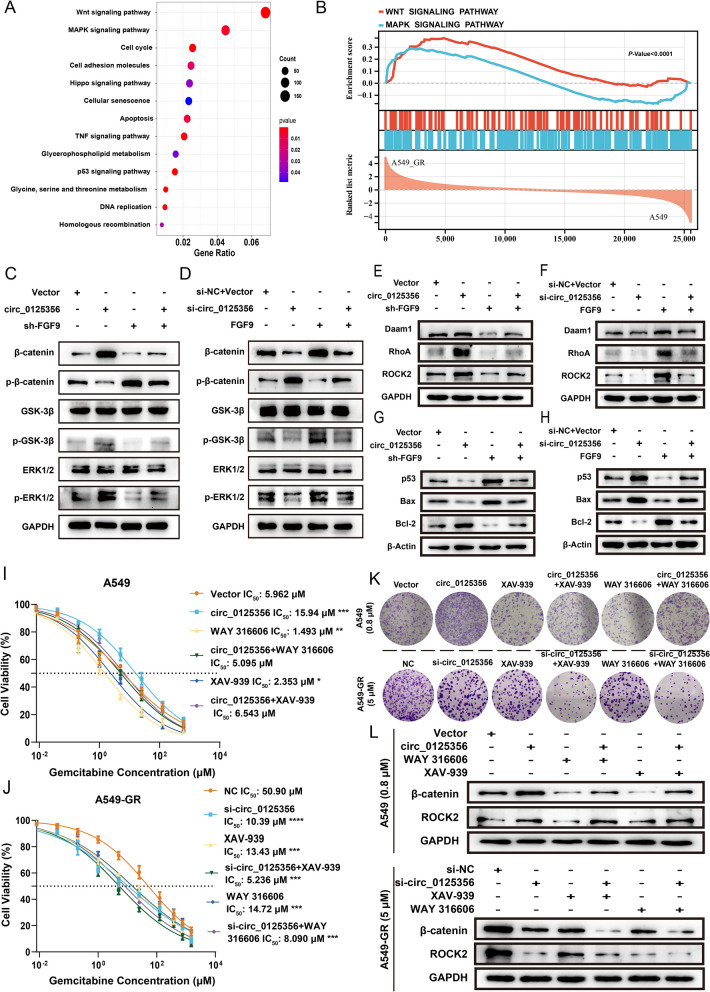
Results: We identified a novel hsa_circ_0125356 as a therapeutic target against gemcitabine resistance. Hsa_circ_0125356 was significantly elevated in clinical samples of patients with NSCLC. Moreover, hsa_circ_0125356 overexpression promoted gemcitabine resistance to NSCLC by upregulating FGF9 via sponging miR-582-5p in vivo and in vitro. Notably, WNT canonical (ERK/GSK3β/β-catenin) and non-canonical (Daam1/RhoA/ROCK2) signaling pathways were activated due to hsa_circ_0125356 acting as an endogenous miR-582-5p sponge to regulate the expression of FGF9, and thereby enhancing gemcitabine resistance via promoting DNA damage repair and inhibition of apoptosis. The results were further confirmed by two small molecule antagonists, WAY 316606 and XAV-939,which could inhibit the activation of WNT signaling pathway induced by hsa_circ_0125356.

Conclusion: We first demonstrated that hsa_circ_0125356 was significantly upregulated and served as a biomarker for gemcitabine resistance in NSCLC by sponging miR-582-5p/FGF9 axis to regulate the WNT canonical and non-canonical signaling pathways, which provided a new direction for identification of therapeutic targets for the treatment of gemcitabine resistance of NSCLC.

Keywords: CircRNAs; FGF9; Gemcitabine resistance; MiR-582-5p; NSCLC; WNT canonical and non-canonical signaling pathways.


Conflict of interest statement

Declarations. Consent for publication: All authors agreed to the publication of the manuscript. Competing interests: The authors declare no competing interests.

Figures

Fig. 1
Fig. 1
Identification of gemcitabine resistance-associated circRNA (hsa_circ_0125356) in NSCLC after gemcitabine treatment. A High throughput circRNA sequencing analysis of circRNA expression profiling in A549 and A549-GR cells. B qRT-PCR indicating the levels of 12 differentially expressed circRNAs in A549 and A549-GR cell lines. C PCR analysis of hsa_circ_0125356 and the linear transcript of SLC7A11 using divergent and convergent primers in cDNA and genomic DNA (gDNA). GAPDH was used as a control. D Schematic of the chromosomal location and formation of hsa_circ_0125356. Sanger sequencing was used to verify the splice junctions. E qRT-PCR analysis of hsa_circ_0125356 using random primers or oligo DT primers in reverse transcription experiments. F Relative RNA levels of hsa_circ_0125356 and linear SLC7A11 treated with RNase R. G Relative abundance of hsa_circ_0125356 and linear SLC7A11 treated with actinomycin D at the indicated time points. H, I The subcellular localization of hsa_circ_0125356 in A549-GR cells was determined by nuclear mass separation assay and fluorescence in situ hybridization. GAPDH and 18S represent cytoplasmic controls, and U6 represents nuclear controls. Scale bar: 10 μm. J In situ hybridization was used to detect the differential expression of hsa_circ_0125356 in paired tumor/paracarcinoma tissue samples from 64 NSCLC patients. Scale bar: 50 μm. K Kaplan–Meier analysis of the correlation between hsa_circ_0125356 expression and overall survival (OS) for NSCLC patients. Data are shown as the mean ± SD. *P < 0.05; **P < 0.01; ***P < 0.001; ****P < 0.0001
Fig. 2
Fig. 2
Hsa_circ_0125356 is critical for maintaining gemcitabine resistance. A The overexpression and knockdown of hsa_circ_0125356 were confirmed by qRT-PCR analysis of hsa_circ_0125356 and SLC7A11 mRNA in A549 and A549-GR cells. B-D The proliferative abilities of stably transfected A549 and A549-GR cells treated with gemcitabine were investigated via CCK-8 assays (cell viability and IC50) and colony formation assays. E The proliferative abilities of stably transfected A549 and A549-GR cells treated with gemcitabine were investigated using EdU assays. Scale bar: 20 μm. F, G TUNEL and Transwell assays were used to detect changes in the apoptosis or migration of stably transfected A549 and A549-GR cells treated with gemcitabine. TUNEL Scale bar: 20 μm. Transwell Scale bar: 50 μm. H Western blotting was used to detect the protein expressions of apoptosis-related proteins in stably transfected A549 and A549-GR cells treated with gemcitabine. Data are shown as the mean ± SD. *P < 0.05; **P < 0.01; ***P < 0.001; ****P < 0.0001
Fig. 3
Fig. 3
Hsa_circ_0125356 acts as a miRNA sponge for miR-582-5p. A Potential target miRNAs of hsa_circ_0125356 were predicted in the Miranda, Circbank, and TargetScan databases. B qRT-PCR was used to detect changes in the expression of 12 miRNAs after circRNA overexpression. C In situ hybridization was used to detect the miR-582-5p expression differences between 25 patients with NSCLC and 25 patients with paracarcinoma. D The negative correlation between hsa_circ_0125356 and miR-582-5p in 25 patients with NSCLC and 25 patients with paracarcinoma was analyzed using Pearson correlation analysis. E qRT-PCR was used to detect the expression difference in miR-582-5p between A549 and A549-GR cells. F The co-localization of hsa_circ_0125356 (red) and miR-582-5p (green) was observed via fluorescence in situ hybridization (FISH) in A549 and A549-GR cells. Cell nuclei were counterstained with DAPI (blue). Scale bar: 10 μm. G RIP assay was performed with anti-AGO2 antibodies or IgG in A549 and A549-GR cells, before performing qRT-PCR to detect the enrichment of hsa_circ_0125356 and miR-582-5p. H Luciferase activity of hsa_circ_0125356-WT or hsa_circ_0125356-MUT after transfection with miR-582-5p mimics or inhibitors in A549 and A549-GR cells. I qRT-PCR was used to analyze the effect of overexpression or knockdown of hsa_circ_0125356 on miR-582-5p. Data are shown as the mean ± SD. *P < 0.05; **P < 0.01; ***P < 0.001; ****P < 0.0001
Fig. 4
Fig. 4
MiR-582-5p reverses gemcitabine resistance of hsa_circ_0125356. A The changes in sensitivity to gemcitabine in A549 and A549-GR cells transfected with miR-582-5p mimics and miR-582-5p inhibitor or co-transfected with overexpressed or knocked down hsa_circ_0125356 were investigated using the CCK-8 assay (IC50). B–D Colony formation, CCK-8, and EdU assays were used to detect changes in the proliferation of stably transfected A549 and A549-GR cells treated with gemcitabine. Scale bar: 20 μm. E Transwell assays were used to detect changes in migration of stably transfected A549 and A549-GR cells treated with gemcitabine. Scale bar: 50 μm. Data are shown as the mean ± SD. *P < 0.05; **P < 0.01; ***P < 0.001; ****P < 0.0001
Fig. 5
Fig. 5
FGF9, functions as a target gene of miR-582-5p, is positively correlated with hsa_circ_0125356 in NSCLC. A Potential target gene of miR-582-5p were predicted in the miRDB, ENCORI, and TargetScan databases. B qRT-PCR was used to detect the changes in the expression of 17 genes after transfection with miR-582-5p mimics. C, D Eight genes with obvious differences were selected, and the overexpression or knockdown hsa_circ_0125356 was transfected to detect the differences in mRNA expression. E Relative luciferase activities in A549 and A549-GR cells co-transfected with FGF9-WT or FGF9-MUT and the miR-582-5p mimics, inhibitor, or corresponding negative control. F, G The relative expression of FGF9 in A549 or A549-GR cells was analyzed by qRT-PCR and western blotting after the indicated transfections. H, I Immunohistochemistry was used to detect the expression difference in FGF9 between 25 patients with NSCLC and 25 patients with paracarcinoma. The correlation between miR-582-5p/hsa_circ_0125356 and FGF9 in NSCLC was analyzed using Pearson′ s correlation analysis. Scale bar: 50 μm. Data are shown as the mean ± SD. *P < 0.05; **P < 0.01; ***P < 0.001; ****P < 0.0001
Fig. 6
Fig. 6
Hsa_circ_0125356 regulated gemcitabine resistance through sponging the miR-582-5p/FGF9 axis. A–B Transcriptome sequencing analysis of A549 and A549-GR cells. C The expression of FGF9 in the culture medium of NSCLC and A549-GR cells was detected by ELISAs kit. D The sensitivity to gemcitabine in stably transfected A549 and A549-GR cells treated with gemcitabine was investigated via CCK-8 assays (IC50). E–G CCK-8 assays (cell viability), colony formation assays, and Transwell assays were used to detect the changes in proliferation and migration of stably transfected A549 and A549-GR cells treated with gemcitabine. Scale bar: 50 μm. H Confocal microscopy was used to analyze the effect of FGF9 on the distribution of γH2AX foci after gemcitabine treatment. Scale bar: 20 μm. I Apoptosis (flow cytometry) of A549 and A549-GR cells transfected with knockdown or overexpression of FGF9 after gemcitabine treatment. J–M A549 and A549-GR cells were transfected with miR-582-5p mimics and miR-582-5p inhibitor or overexpression and knockdown of hsa_circ_0125356 and FGF9. The proliferative ability of the indicated cells treated with gemcitabine was investigated via CCK-8 assays (IC50 and cell viability), colony formation, and EdU assays. Scale bar: 20 μm. N Transwell assays were used to detect the changes in the migration of miR-582-5p mimics and miR-582-5p inhibitors or the overexpression and knockdown of hsa_circ_0125356 and FGF9-transfected A549 and A549-GR cells treated with gemcitabine. Scale bar: 50 μm. Data are shown as the mean ± SD. *P < 0.05; **P < 0.01; ***P < 0.001; ****P < 0.0001
Fig. 7
Fig. 7
FGF9 enhances gemcitabine resistance by promoting the WNT canonical and noncanonical signaling pathways. A Genomes (KEGG) analysis based on RNA-seq data. B GSEA enrichment analysis of signaling pathways. C-F Western blotting analysis was performed to assess the levels of WNT signaling pathway-related proteins (GSK-3β phosphorylation, ERK1/2 phosphorylation, and β-catenin phosphorylation) and noncanonical WNT signaling pathway-related proteins (Daam1, RhoA, and ROCK2) in A549 and A549-GR cells from different groups treated with gemcitabine. GAPDH was used as a loading control. G, H Western blotting analysis was performed to assess the levels of apoptosis-related proteins in A549 and A549-GR cells from different groups treated with gemcitabine. β-Actin was used as a loading control. I-K A549 and A549-GR cells transfected with overexpressed hsa_circ_0125356, knockdown of hsa_circ_0125356, WAY 316606, and XAV-939, and the proliferative ability of the indicated cells treated with gemcitabine was investigated via CCK-8 assays (IC50) and colony formation assays. L Western blotting was performed to assess the protein levels of β-catenin and ROCK2 in A549 and A549-GR cells treated with gemcitabine after transfected with overexpression hsa_circ_0125356, knockdown of hsa_circ_0125356, WAY 316606, and XAV-939. Data are shown as the mean ± SD. *P < 0.05; **P < 0.01; ***P < 0.001; ****P < 0.0001 between the indicated groups
Fig. 8
Fig. 8
Knockdown or overexpression of hsa_circ_0125356 affected gemcitabine sensitivity in vivo. A An outline of the tumor inoculation and systemic injection process. B BALB/c nude mice were subcutaneously injected with stably transfected A549 cells. Images of gross tumors dissected from the subcutaneous xenograft model and weight of resected tumor in the xenograft model. C Tumor volumes were recorded twice a week. D BALB/c nude mice were subcutaneously injected with stably transfected A549-GR cells. Images of gross tumors dissected from the subcutaneous xenograft model and weight of resected tumor in the xenograft model. E Tumor volumes were recorded twice a week. F, G TUNEL assay was used to detect changes in apoptosis from the subcutaneous xenograft model. Scale bar: 20 μm. H, I Representative images of IHC for Ki-67 in xenografts. Scale bar: 20 μm and 50 μm. Data are shown as the mean ± SD. *P < 0.05; **P < 0.01; ***P < 0.001; ****P < 0.0001
Fig. 9
Fig. 9
Hsa_circ_0125356 activates the WNT canonical and non-canonical signaling pathways by regulating the miR-582-5p/FGF9 axis to maintain gemcitabine resistance in vivo. A, B Representative images of FGF9 IHC in xenografts. Scale bar: 20 μm and 50 μm. C, D Representative images of FISH analyses of hsa_circ_0125356 and miR-582-5p in xenografts. Scale bar: 20 μm. E Western blotting analysis was performed to assess the protein levels of the WNT canonical signaling pathways (ERK1/2, p-ERK1/2, β-catenin, p-β-catenin, GSK-3β, p-GSK-3β) in xenografts from different treatments. GAPDH was used as a loading control. F Western blotting was performed to assess the protein levels of the WNT non-canonical signaling pathways (Daam1, RhoA, and ROCK2) in xenografts from different treatments. GAPDH was used as a loading control. G Western blotting was performed to assess the levels of apoptosis-related proteins in xenografts from different treatments. β-Actin was used as a loading control. Data are shown as the mean ± SD. *P < 0.05; **P < 0.01; ***P < 0.001; ****P < 0.0001
Fig. 10
Fig. 10
Schematic illustration of the mechanism by which hsa_circ_0125356/miR-582-5p/FGF9 axis activates the WNT canonical and non-canonical signaling pathway and promotes gemcitabine-resistance in NSCLC

References

    1. Ferlay J, Colombet M, Soerjomataram I, Mathers C, Parkin DM, Piñeros M, Znaor A, Bray F. Estimating the global cancer incidence and mortality in 2018: GLOBOCAN sources and methods. Int J Cancer. 2019;144:1941–53. - PubMed
    1. Del VV, Denti MA. microRNA and Lung Cancer. Adv Exp Med Biol. 2015;889:153–77. - PubMed
    1. Seidl C, Panzitt K, Bertsch A, Brcic L, Schein S, Mack M, Leithner K, Prinz F, Olschewski H, Kornmueller K, Hrzenjak A. MicroRNA-182-5p regulates hedgehog signaling pathway and chemosensitivity of cisplatin-resistant lung adenocarcinoma cells via targeting GLI2. Cancer Lett. 2020;469:266–76. - PubMed
    1. Zhong L, Sun S, Shi J, Cao F, Han X, Chen Z. MicroRNA-125a-5p plays a role as a tumor suppressor in lung carcinoma cells by directly targeting STAT3. Tumour Biol. 2017;39:1393392085. - PubMed
    1. Dutta RK, Chinnapaiyan S, Unwalla H. Aberrant MicroRNAomics in Pulmonary Complications: Implications in Lung Health and Diseases. Mol Ther Nucleic Acids. 2019;18:413–31. - PMC - PubMed

MeSH terms

LinkOut - more resources