. 2025 May;206(5):1485-1496.
doi: 10.1111/bjh.20031. Epub 2025 Feb 26.

Iron trapping in macrophages reshapes the homeostasis of the haematopoietic system

Affiliations

Iron trapping in macrophages reshapes the homeostasis of the haematopoietic system

Laura Crisafulli et al. Br J Haematol. 2025 May.

Abstract

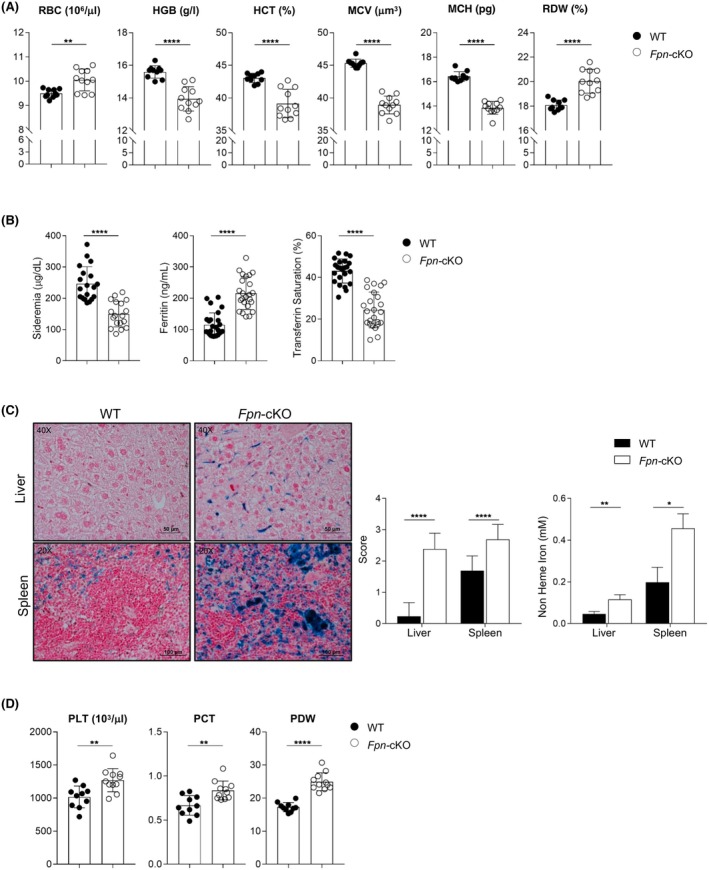
Iron is required for key physiological processes, like oxygen transport, energy production and cell proliferation. Body iron homeostasis is regulated by the erythroferrone-hepcidin-ferroportin (FPN) axis, which mainly acts on absorptive duodenal cells and macrophages involved in iron recycling from red blood cell breakdown. In addition to systemic iron regulation, macrophages are also involved in local iron release to neighbouring cells. Similarly, bone marrow (BM)-resident macrophages could represent promptly available local sources of iron for developing haematopoietic cells. To study the impact of macrophage-released iron on BM haematopoietic stem and progenitor cells, we employed mice with targeted deletion of Fpn in the myeloid lineage (Fpn conditional knockout or Fpn-cKO). Fpn-cKO mice develop age-related anaemia and microcytaemia, reduction of BM erythroblasts and preferential megakaryopoiesis at the expenses of erythropoiesis, suggesting that red cells are mostly affected by the lack of myeloid-derived iron delivery. Transferrin receptor 1 surface expression is higher in Fpn-cKO mice than littermate controls in all the BM subpopulation analysed, starting from haematopoietic stem cells, indicating a broad BM sensitivity to lower iron availability. Last, Fpn-cKO mice activate systemic compensatory mechanisms, such as extramedullary haematopoiesis and erythroferrone upregulation, albeit not sufficient to overcome anaemia.

Keywords: anaemia; animal model; haematopoiesis; iron; macrophages; red cells.


Conflict of interest statement

The authors have no conflicts of interest to declare.

Figures

FIGURE 1
FIGURE 1
Haematological parameters and iron distribution of Fpn‐cKO mice. (A) Blood analysis of erythropoietic parameters. From left to right: Red blood cell (RBC) counts, haemoglobin (HGB) level, haematocrit (HCT), mean corpuscular volume (MCV), mean corpuscular haemoglobin (MCH), red cell distribution width (RDW). (B) Levels of serum iron, ferritin and transferrin saturation. (C) Left: representative histology of Perls' Prussian Blue iron staining of liver and spleen in WT and Fpn‐cKO mice. Centre: semiquantitative evaluation of Perls' iron staining. Right: quantification of non‐haem iron in liver and spleen, normalized for the total protein content. (D) Haemocytometric parameters relative to platelets (PLT). From left to right: PLT counts, plateletcrit (PTC), PLT distribution width (PDW). (A, D) WT: n = 10 (6 females and 4 males); Fpn‐cKO: n = 11 (5 females and 6 males); (B) WT: n = 19, Fpn‐cKO: n = 18; (C) For the score, WT: n = 16–17 (for spleen and liver respectively), Fpn‐cKO: n = 13; for non‐haem iron: WT: n = 6, Fpn‐cKO: n = 9. Data are presented as mean ± SD. *p < 0.05; **p < 0.01; ****p < 0.0001.
FIGURE 2
FIGURE 2
Bone Marrow and Spleen analysis of Fpn‐cKO mice. (A) Body weight (BW) of WT and Fpn‐cKO mice. (B) Ratio of spleen weight over BW (left) and representative image of spleen size (right). (C) Left: representative images of spleen histology (H&E staining) showing perturbed architecture and myeloid extramedullary haematopoiesis in Fpn‐cKO mice. Bottom images depict higher magnification of the indicated inset in the corresponding top images. Right: spleen extramedullary haematopoiesis score. (D) BM cell number (from one lower limb). (A, B) WT: n = 30, Fpn‐cKO: n = 30; (C) WT: n = 16, Fpn‐cKO: n = 13. (D) WT: n = 14; Fpn‐cKO: n = 16. Data are presented as mean ± SD. *p < 0.05; **p < 0.01.
FIGURE 3
FIGURE 3
FACS analysis of bone marrow (BM) erythroid development in Fpn‐cKO and WT mice. (A) Histogram indicating the absolute number of BM T (CD3+) and B (CD19+) lymphocytes, myeloid cells (CD11b+) and erythroblasts (Eblasts, TER119+); data are presented as mean ± SEM. (B) Histogram indicating the frequency of the same cell population depicted in (A). (C) Representative FACS analysis of BM red cell development. (D) Histogram indicating the absolute number of erythroid cells (all TER119+) classified in the I–IV progressively more mature fractions, as depicted in (C). (E) Histogram indicating the frequency of the erythroid cells depicted in (D). (F) Representative Perls' Prussian Blue iron staining of BM films in WT and Fpn‐cKO mice. (G) Expression of alpha (Hba) and beta (Hbb) globin in sorted BM TER119+ erythroblasts measured by quantitative RT‐PCR, normalized to the housekeeping gene 18S RNA and represented as fold difference (FD) of Fpn‐cKO mice over WT. BM cells were harvested from one lower limb. WT: n = 14; Fpn‐cKO: n = 16. Data are presented as mean ± SEM. *p < 0.05; **p < 0.01; ***p < 0.001.
FIGURE 4
FIGURE 4
Alterations in bone marrow (BM) myeloid cells of Fpn‐cKO mice. (A) Frequencies within BM CD45+ cells of polymorphonucleated (PMN) cells, monoblasts, pro‐monocytes and monocytes. (B) Left: Representative histogram overlay of macrophages from WT and Fpn‐cKO mice; centre: frequency of macrophages within BM CD45+ cells; right: histogram indicating F4/80 expression in macrophages measured as MFI. (C) FACS analysis of erythroblastic island macrophages (EIM) defined as CD45+CD3CD19B220NK1.1Ly6G, CD11b−/low, F4/80+, CD169+, CD106 (VCAM1)+. From left to right: EIM frequency within BM CD45+ cells, expression level of VCAM, surface expression of CD169, representative Perls' Prussian Blue iron staining of BM films in WT and Fpn‐cKO mice (magnification: 100×); BM cells were harvested from one lower limb. (D) FACS analysis of red pulp macrophages (RPM) defined as CD45+CD3CD19B220NK1.1Ly6G, CD11c, MHCII+, strong autofluorescence, Ly6C−/low, CD11b−/low, F4/80high, Tim4+, MERTK+, CD64+, CD68+ (see also Figure S4C). From left to right: RPM frequency within spleen CD45+ cells, surface expression level of CD64, expression of CD68. Data are presented as mean ± SD. *p < 0.05.
FIGURE 5
FIGURE 5
The absence of iron released by myeloid cells is sensed at the apex of the haematopoietic hierarchy. (A) Representative FACS analysis of bone marrow (BM) stem cells, progenitors and precursors. (D) Frequencies of lineage‐negative (Lin) cells, pre‐megakaryocyte‐erythroid progenitor (pMegE) cells, pre‐colony‐forming unit‐erythroid (pCFU‐E) cells, CFU‐E, pre‐granulocyte–macrophage progenitor (pGM) cells and granulocyte–macrophage progenitors (GMP) within total BM. (C) Frequencies of LincKit+Sca1+ (LKS) cells, multipotent progenitor (MPP) cells and haematopoietic stem cells (HSC) within total BM. (D) Absolute number of HSCs within total BM. For all histograms, WT: n = 10; Fpn‐cKO: n = 12. BM cells were harvested from one lower limb. Data are presented as mean ± SD. *p < 0.05.
FIGURE 6
FIGURE 6
Local and systemic compensatory mechanisms to counteract long‐term deprivation of myeloid‐derived iron. (A) Expression of TFR1 within the different fractions of bone marrow (BM) erythroid development (from I to IV) measured as mean fluorescence intensity (MFI) with a fluorescent‐conjugated anti‐TFR1 monoclonal antibody. (B) Expression of TFR1 within haematopoietic stem cell (HSC) and different progenitors and precursors measured as MFI. (C) Representative histogram overlays indicating the expression of TFR1 as MFI in some of the populations shown in B. (D) Hepcidin mRNA level in liver (HAMP, left) and hepcidin serum concentration (right). (E) ERFE (Fam132b, left) and FGL1 (right) mRNA levels in spleen and liver respectively. All gene expression analyses, referred to 24‐week‐old mice, are measured by quantitative RT‐PCR and normalized to the housekeeping gene 18S RNA or GAPDH. (F) Erythropoietin serum concentration measured by enzyme linked immuno sorbent assay (ELISA) (A, B) WT: n = 10; Fpn‐cKO: n = 12. (D–F) WT: n = 12–17; Fpn‐cKO: n = 11–23. Data are presented as mean ± SD. *p < 0.05; **p < 0.01; ***p < 0.001; ****p < 0.0001.

References

    1. Recalcati S, Gammella E, Buratti P, Cairo G. Molecular regulation of cellular iron balance. IUBMB Life. 2017;69(6):389–398. - PubMed
    1. Muckenthaler MU, Rivella S, Hentze MW, Galy B. A red carpet for iron metabolism. Cell. 2017;168(3):344–361. - PMC - PubMed
    1. Kautz L, Jung G, Valore EV, Rivella S, Nemeth E, Ganz T. Identification of erythroferrone as an erythroid regulator of iron metabolism. Nat Genet. 2014;46(7):678–684. - PMC - PubMed
    1. Sardo U, Perrier P, Cormier K, Sotin M, Personnaz J, Medjbeur T, et al. The hepatokine FGL1 regulates hepcidin and iron metabolism during anemia in mice by antagonizing BMP signaling. Blood. 2023;143(13):1282–1292. - PMC - PubMed
    1. Recalcati S, Gammella E, Buratti P, Doni A, Anselmo A, Locati M, et al. Macrophage ferroportin is essential for stromal cell proliferation in wound healing. Haematologica. 2019;104(1):47–58. - PMC - PubMed