. 2025 Feb 27;44(1):74.
doi: 10.1186/s13046-025-03334-6.

Radiotherapy resistance driven by Asparagine endopeptidase through ATR pathway modulation in breast cancer

Affiliations

Radiotherapy resistance driven by Asparagine endopeptidase through ATR pathway modulation in breast cancer

Macarena Morillo-Huesca et al. J Exp Clin Cancer Res. .

Abstract

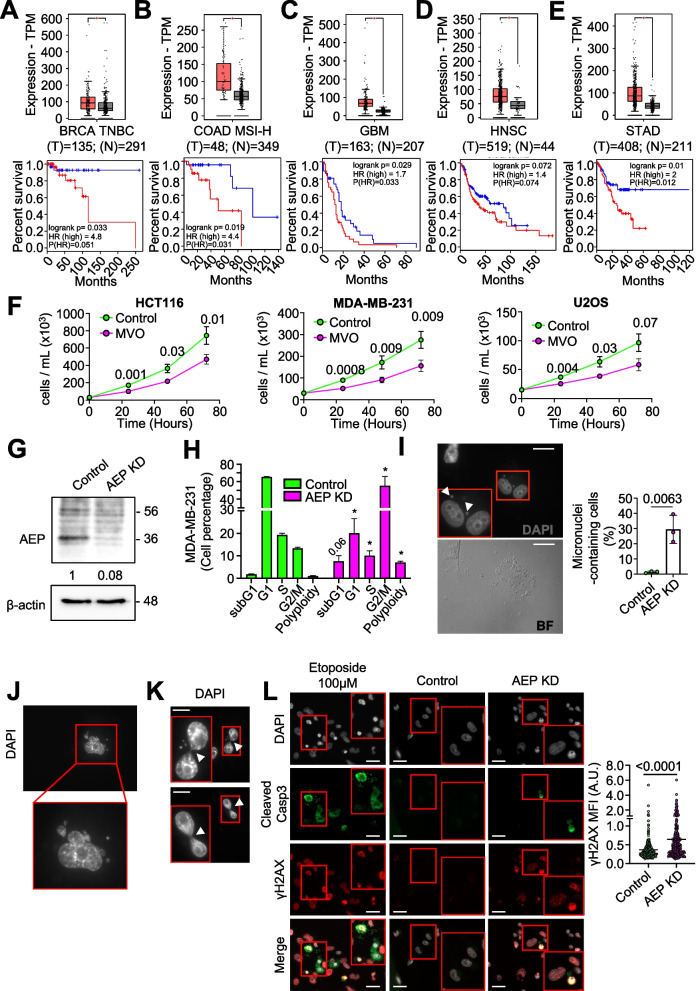
Background: Tumor resistance represents a major challenge in the current oncology landscape. Asparagine endopeptidase (AEP) overexpression correlates with worse prognosis and reduced overall survival in most human solid tumors. However, the underlying mechanisms of the connection between AEP and reduced overall survival in cancer patients remain unclear.

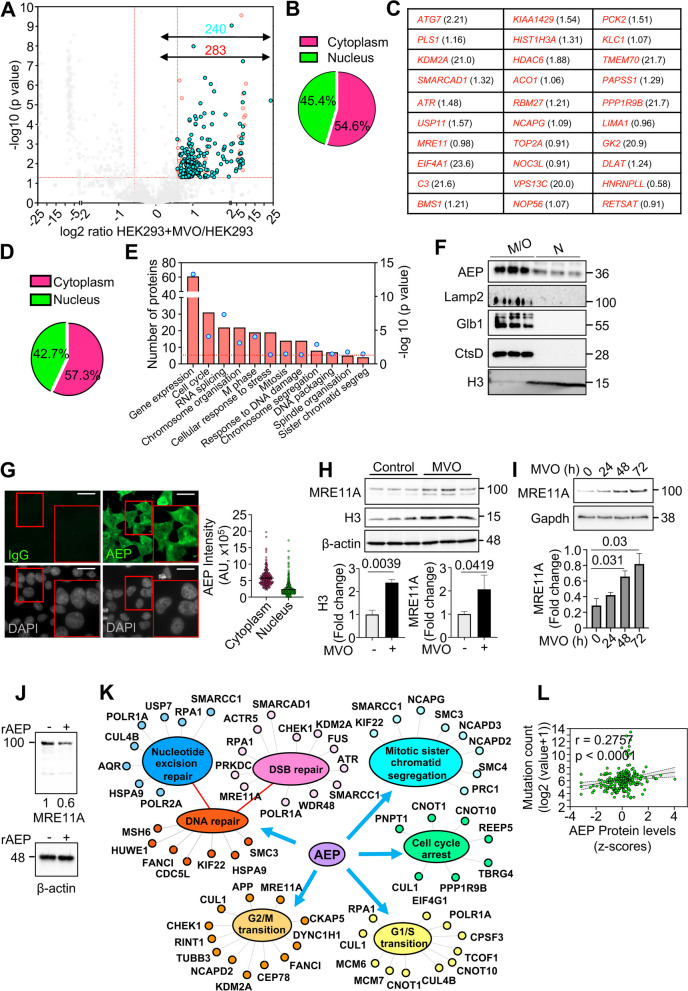
Methods: High-throughput proteomics, cellular and molecular biology approaches and clinical data from breast cancer (BC) patients were used to identify novel, biologically relevant AEP targets. Immunoblotting and qPCR analyses were used to quantify protein and mRNA levels. Flow cytometry, confocal microscopy, chemical inhibitors, siRNA- and shRNA-silencing and DNA repair assays were used as functional assays. In-silico analyses using the TCGA BC dataset and immunofluorescence assays in an independent cohort of invasive ductal (ID) BC patients were used to validate the clinical relevance of our findings.

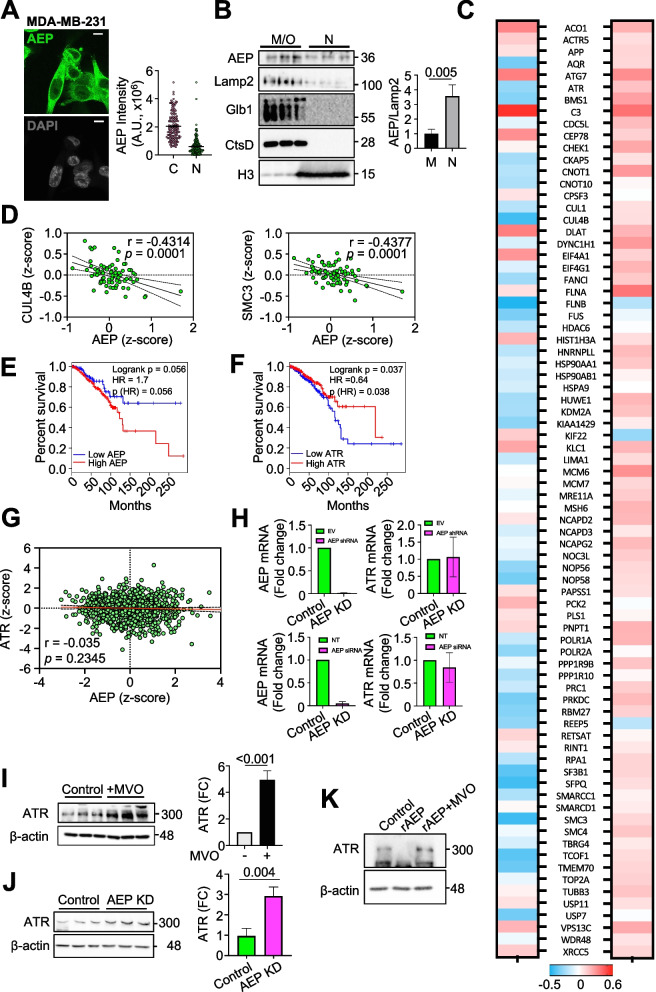
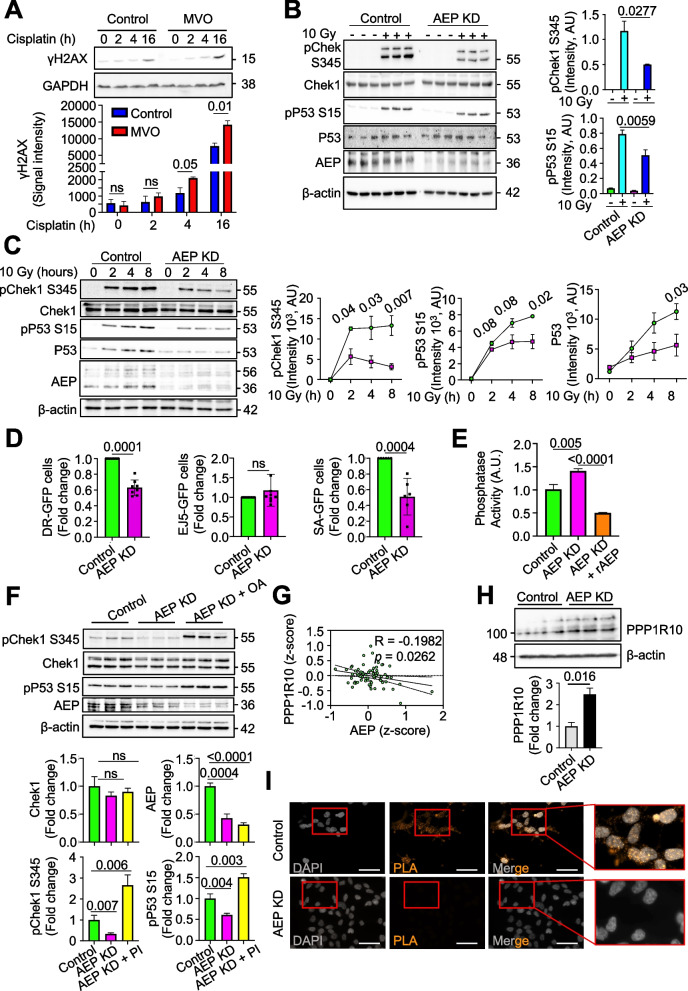
Results: Here we showed a dual role for AEP in genomic stability and radiotherapy resistance in BC patients by suppressing ATR and PPP1R10 levels. Reduced ATR and PPP1R10 levels were found in BC patients expressing high AEP levels and correlated with worst prognosis. Mechanistically, AEP suppresses ATR levels, reducing DNA damage-induced cell death, and PPP1R10 levels, promoting Chek1/P53 cell cycle checkpoint activation, allowing BC cells to efficiently repair DNA. Functional studies revealed AEP-deficiency results in genomic instability, increased DNA damage signaling, reduced Chek1/P53 activation, impaired DNA repair and cell death, with phosphatase inhibitors restoring the DNA damage response in AEP-deficient BC cells. Furthermore, AEP inhibition sensitized BC cells to the chemotherapeutic reagents cisplatin and etoposide. Immunofluorescence assays in an independent cohort of IDBC patients showed increased AEP levels in ductal cells. These analyses showed that higher AEP levels in radioresistant IDBC patients resulted in ATR nuclear eviction, revealing AEPhigh/ATRlow protein levels as an efficient predictive biomarker for the stratification of radioresistant patients.

Conclusion: The newly identified AEP/ATR/PPP1R10 axis plays a dual role in genomic stability and radiotherapy resistance in BC. Our work provides new clues to the underlying mechanisms of tumor resistance and strong evidence validating the AEP/ATR axis as a novel predictive biomarker and therapeutic target for the stratification and treatment of radioresistant BC patients.


Conflict of interest statement

Declarations. Ethics approval and consent to participate: This study was conducted in accordance with the ethical standards set forth in the Spanish legislation (Ley de Investigacion Organica Biomedica, 14 July 2007) and was approved by the ethical committees of the MD Anderson Cancer Centre Madrid, Spain. A comprehensive written informed consent was obtained from all participants. All authors followed the applicable ethical standards to maintain research integrity. Consent for publication: All authors have read the final version of the manuscript and agree with its publication. Competing interests: The authors declare no competing interests.

Figures

Fig. 1
Fig. 1
AEP deficiency reduces cell proliferation and impact cell cycle in cancer cells. Differential expression levels of AEP in different types of tumors were obtained using the GEPIA2 online application and extracted from The Cancer Genome Atlas (TCGA) database. Kaplan–Meier curves were constructed using the GEPIA2 online application to assess the correlation between AEP expression levels (low AEP blue line; high AEP red line) in different types of human tumors and overall survival. A AEP expression levels in BRCA triple-negative breast cancer (TNBC) patients (n = 135, red) as compared to normal samples (n = 291, grey) [upper panel] and Kaplan–Meier curves showing overall survival of patients with high (red line) or low (blue line) AEP expression levels [lower panel]. B AEP expression levels in colon adenocarcinoma with high genomic instability (COAD MSI-H) patients (n = 48, red) as compared to normal samples (n = 349, grey) [upper panel] and Kaplan–Meier curves showing overall survival of patients with high (red line) or low (blue line) AEP expression levels [lower panel]. C AEP expression levels in glioblastoma (GBM) patients (n = 163, red) as compared to normal samples (n = 207, grey) [upper panel] and Kaplan–Meier curves showing overall survival of patients with high (red line) or low (blue line) AEP expression levels [lower panel]. D AEP expression levels in head and neck squamous cell carcinoma (HNSC) patients (n = 519, red) as compared to normal samples (n = 44, grey) [upper panel] and Kaplan–Meier curves showing overall survival of patients with high (red line) or low (blue line) AEP expression levels [lower panel]. E AEP expression levels in stomach adenocarcinoma (STAD) patients (n = 408, red) as compared to normal samples (n = 211, grey) [upper panel] and Kaplan–Meier curves showing overall survival of patients with high (red line) or low (blue line) AEP expression levels [lower panel]. F Proliferation curves of different cancer cell lines (HCT116 [left panel], MDA-MB-231 [middle panel] and U2OS [right panel]) upon MVO-mediated AEP inhibition. Data represents average of 5 independent, biological replicas ± SD. G Immunoblot showing the shRNA-mediated AEP knock-down in MDA-MB-231 cells. H Cell cycle analyses of control and AEP shRNA-transduced MDA-MB-231 cells. Data represents average of 4 independent, biological replicas ± SD. * p value < 0. 01. I Micrographs showing the presence of micronuclei in MDA-MB-231 cells upon shRNA-mediated AEP KD alongside quantitation. Data represents the average of 3 independent experiments, each one including more than 100 cell ± SD. Size bar = 27 μm. J Micrographs showing examples of polyploid cells in shRNA-mediated AEP KD MDA-MB-231 cells. K Micrographs showing internuclear DNA bridges in shRNA-mediated AEP KD MDA-MB-231 cells. Arrowheads indicate DNA bridges. Size bar = 27 μm. L Micrographs showing γH2AX (red) and cleaved caspase 3 (green) staining in MDA-MB-231 cells treated with 100 μM etoposide for 24 h (left panels), MDA-MB-231 control cells (middle panels) and AEP shRNA-transduced MDA-MB-231 cells (right panels) alongside quantitation representing γH2AX mean fluorescence intensity (MFI) in cells negative for cleaved caspase 3. (n > 300 cells). Size bar = 27 μm
Fig. 2
Fig. 2
Proteomics study of MVO26630-mediated AEP inhibition in HEK293 cells reveals a putative nuclear role for AEP. A Volcano plot showing in red proteins whose levels are increased (283) and in cyan those that are increased and their putative cleavage site has been identified (240) upon 24-h MVO26630 treatment. B Pie chart showing nuclear and cytoplasmic distribution of the proteins accumulating upon MVO treatment. C Proteins showing the highest accumulation for which their putative AEP cleavage site has been identified upon MVO treatment as indicated by our proteomics data, alongside fold change in parenthesis (log2 of the HEK293 + MVO/HEK293 ratio). D Pie chart showing nuclear and cytoplasmic distribution of the proteins accumulating upon MVO treatment for which their putative AEP cleavage site has been identified. E GO analysis (Biological processes) of the proteins accumulating upon MVO treatment for which their putative AEP cleavage site has been identified (240 proteins). F Subcellular fractionation analyses (M/O – membrane/organelle, N—nucleus) of AEP localization in HEK293 cells, including Lamp2 as a lysosomal membrane marker, Glb1 and CtsD as soluble lysosomal hydrolases, and H3 as a nuclear marker. G Micrographs showing AEP nuclear localization in HEK293 cells under normal conditions alongside quantitation of the AEP intensity (n > 400 cells) corrected using a sheep IgG isotype, showing both cytoplasmic vs nuclear data (Size bar = 6um). H Immunoblot showing the levels of MRE11A and H3 in MVO-treated vs untreated HEK293 cells, alongside quantitation. Data represents the average of 3 independent, biological replicas ± SD. I Immunoblot showing the levels of MRE11A in HEK293 treated with MVO for 0, 24, 48 or 72 h, alongside quantitation. Data represents the average of 3 independent, biological replicas ± SD. J Immunoblot showing the in vitro digestion of MRE11A overexpressed in HEK293 cells using recombinant AEP (rAEP) in pH7.2 for 3 h. K Schematic representation of some of the newly identified targets of AEP highlighting the biological processes regulated by AEP as extracted from our GO analysis. L Correlation analyses between AEP protein expression levels (z-score) and mutation count (log2 (value + 1)) in TCGA pan cancer samples obtained through cBioportal
Fig. 3
Fig. 3
AEP localizes in the nuclear compartment of cancer cells and regulates the levels of ATR. A Immunofluorescence showing the subcellular localization of AEP in MDA-MB-231 (n > 150 cells) alongside quantitation showing the cytoplasmic (C) and nuclear (N) intensity, corrected using a sheep IgG antibody. (Size bar = 6um). B Immunoblot showing the nuclear (N) and membrane/organelle (M/O) localization of AEP in MDA-MB-231, including Lamp2 as a lysosomal membrane marker, Glb1 and CtsD as soluble lysosomal hydrolases and H3 as a nuclear marker, alongside quantitation. Data represents the average ± SD of three independent, biological replicas. C Correlation analyses between AEP and the main proteins identified as novel AEP targets in our proteomic experiment in breast cancer patients at the protein (left panel) and RNA (right panel) levels. D Correlation analysis of the protein expression levels of some of the novel AEP targets identified in our proteomic analyses (CUL4B and SMC3) vs AEP in BC patients using data obtained from the TCGA database. E Kaplan–Meier analysis of breast cancer patients expressing high (red line, n = 503) or low (blue line, n = 129) AEP levels. F Kaplan–Meier analysis of breast cancer patients expressing high (red line, n = 319) or low (blue line, n = 268) ATR levels. G Correlation analysis of the mRNA expression levels of ATR vs AEP in BC patients using data obtained from the TCGA database. H qPCR analyses of the mRNA expression levels of AEP and ATR in control (EV, empty vector) and AEP shRNA (upper panels) or control (NT, non-targeting) and AEP siRNA KD (bottom panels) MDA-MB-231 cells. I Immunoblot showing the effect of MVO-mediated AEP inhibition in the levels of ATR in MDA-MB-231 cells alongside quantitation. Data represents the average ± SD of three independent, biological replicas. J Immunoblot showing the effect of shRNA-mediated AEP knock-down in MDA-MB-231 cells in the levels of ATR alongside quantitation. Data represents the average ± SD of three independent, biological replicas. K Immunoblot showing the in vitro digestion of ATR using recombinantly expressed AEP at pH7.2 for 3 h
Fig. 4
Fig. 4
Nuclear AEP activity reduces DNA damage signaling while targeting phosphatase activity to maintain proper cell cycle checkpoint activation in breast cancer cells. A Immunoblot of γH2AX in MDA-MB-231 treated or not with MVO 50 μM for 48 h and then stimulated with cisplatin 3 μM, alongside quantitation. Data represents the mean + SD of three, independent biological replicas. B Immunoblot showing the phosphorylation levels of Chek1 and P53 upon 10 Gy radiation and 2 h recovery in both control and AEP KD MDA-MB-231, alongside quantitation. Data represents the mean ± SD of three independent, biological replicas. C Time course showing the phosphorylation levels pf Chek1 and P53 upon 10 Gy radiation followed by 2-, 4- or 8-h recovery, alongside quantitation in control (green circles) and AEP KD (pink squares) MDA-MB-231 cells. Data represents the mean ± SD of three independent, biological replicas. D Graph showing the effect of AEP deficiency in DNA repair using U2OS cells depleted or not of AEP and stably expressing DR-GFP, EJ5-GFP or SSA-GFP reporters constructs. After 72 h GFP fluorescence was analysed by flow cytometry. Data show average fold change ± SD of the number of positive cells for each system compared to control cells. Data was generated from at least six independent, biological replicas. E Phosphatase activity in control vs AEP KD ± rAEP MDA-MB-231 cells. Data represents the mean ± SD of three independent, biological replicas. F Immunoblot showing the levels of phosphorylation of Chek1 upon 10 Gy radiation and 2 h recovery in control MDA-MB-231 cells compared to AEP KD MDA-MB-231 pre-treated or not with 10 μM okadaic acid (OA) 30 min prior to irradiation, alongside quantitation. Data represents the mean ± SD of three independent, biological replicas. G Correlation analysis of the protein expression levels of PPP1R10 vs AEP in BC patients using data obtained from the TCGA database. H Immunoblot showing PPP1R10 levels in control and AEP KD MDA-MB-231 cells, alongside quantitation. Data represents the mean ± SD of three independent, biological replicas. I Proximity ligation assay (PLA) using anti-AEP and anti-PPP1R10 in control and AEP KD MDA-MB-231 cells
Fig. 5
Fig. 5
AEP contributes to breast cancer resistance to genotoxic stress. A Correlation analysis of AEP and ATR protein levels in BC patients using the TCGA breast carcinoma dataset. B Kaplan–Meier analysis in breast cancer patients expressing high (red dots) or low levels (cyan dots) of AEP at the protein level. C Kaplan–Meier analysis in BC patients expressing high (red dots) or low levels (cyan dots) of ATR at the protein level. D Heatmap showing the levels of protein (AEP and ATR, z-scores) expressed in BC patients. E Kaplan–Meier analysis in BC patients expressing AEPlow/ATRhigh levels (cyan dots) vs AEPhigh/ATRlow levels (red dots) at the protein level. F Kaplan–Meier analysis in BC patients showing AEPhigh/ATR.low protein levels treated (red dots) or untreated (cyan dots) with radiation. G Dose response of cisplatin in MDA-MB-231 cells in the presence (magenta bars) or absence (green bars) of MVO. H Dose response of etoposide in MDA-MB-231 cells in the presence (magenta bars) or absence (green bars) of MVO. ns: no significant, * p < 0.05
Fig. 6
Fig. 6
Increased AEP levels reduce ATR nuclear levels in ductal breast carcinoma cells in chemotherapy non-responder human patients. A Microscopy images (10x) of the immunohistochemical analysis of AEP expression in responder and non-responder invasive ductal breast carcinoma samples. (Size bar = 200 μm). B Immunofluorescence analysis of AEP expression levels in ductal breast carcinoma cells in responder and non-responder patients, alongside quantitation. Data represents the average AEP expression levels quantified using samples from 10 responder (50 cells per patient) and 10 non-responder (50 cells per patient) patients. (Size bar = 20 μm). C Immunofluorescence analysis of the expression levels of AEP and ATR in ductal breast carcinoma cells in responder and non-responder patients. Each pair represents the average ATR and AEP expression levels obtained upon quantification of data obtained per patient using 50 cells per patient. (Size bar = 20 μm). D Heatmap showing the protein levels (AEP and ATR, z-scores) expressed in invasive ductal breast cancer patients organized into responder and non-responder patients. E Immunofluorescence analysis of the nuclear AEP expression levels in ductal breast carcinoma cells in responder (n = 10) and non-responder (n = 10) patients, alongside quantitation. Data represents the average nuclear level of AEP obtained from the quantification of at least 80 cells per patient. (Size bar = 20 μm). White asterisk indicates AEP-positive nuclei in non-responder samples as compared to responder samples. F Nuclear AEP/ATR ratio obtained from responder (n = 10) and non-responder (n = 10) patients. Each dot represents the average nuclear AEP/ATR ratio obtained for each patient upon quantification of at least 80 cells per patient
Fig. 7
Fig. 7
AEP plays a dual role in radiotherapy resistance in BC patients. In BC patients, AEP reduces DNA damage response by suppressing ATR levels, while maintaining sustained Chek1 and P53 activation through the suppression of PPP1R10 levels and PP1 activity, thus allowing cancer cells to scape DNA damage-induced cell death and to efficiently repair DNA damage, thus explaining the role of AEP in radiotherapy resistance (left panel). Conversely, AEP deficiency in cancer cells result in increased ATR levels leading to elevated DNA damage signaling and increased PP1 activity, resulting in reduced levels pf pChek1 and pP53 leading to reduced DNA repair, increased genomic instability and cell death (right panel)

Similar articles

References

    1. Liu YP, Zheng CC, Huang YN, He ML, Xu WW, Li B. Molecular mechanisms of chemo- and radiotherapy resistance and the potential implications for cancer treatment. MedComm. 2020;2021(2):315–40. - PMC - PubMed
    1. Chen Z, Han F, Du Y, Shi H, Zhou W. Hypoxic microenvironment in cancer: molecular mechanisms and therapeutic interventions. Signal Transduct Target Ther. 2023;8:70. - PMC - PubMed
    1. Wu Y, Song Y, Wang R, Wang T. Molecular mechanisms of tumor resistance to radiotherapy. Mol Cancer. 2023;22:96. - PMC - PubMed
    1. Lin X, Kong D, Chen ZS. Editorial: Chemo-Radiation-Resistance in Cancer Therapy. Front Pharmacol. 2022;13: 904063. - PMC - PubMed
    1. Kos J, Mitrovic A, Perisic Nanut M, Pislar A. Lysosomal peptidases-intriguing roles in cancer progression and neurodegeneration. FEBS Open Bio. 2022;12:708–38. - PMC - PubMed

MeSH terms

Substances